29
/
en
AIzaSyAYiBZKx7MnpbEhh9jyipgxe19OcubqV5w
April 1, 2024
212947
Nigeria
NGA
true
2
1
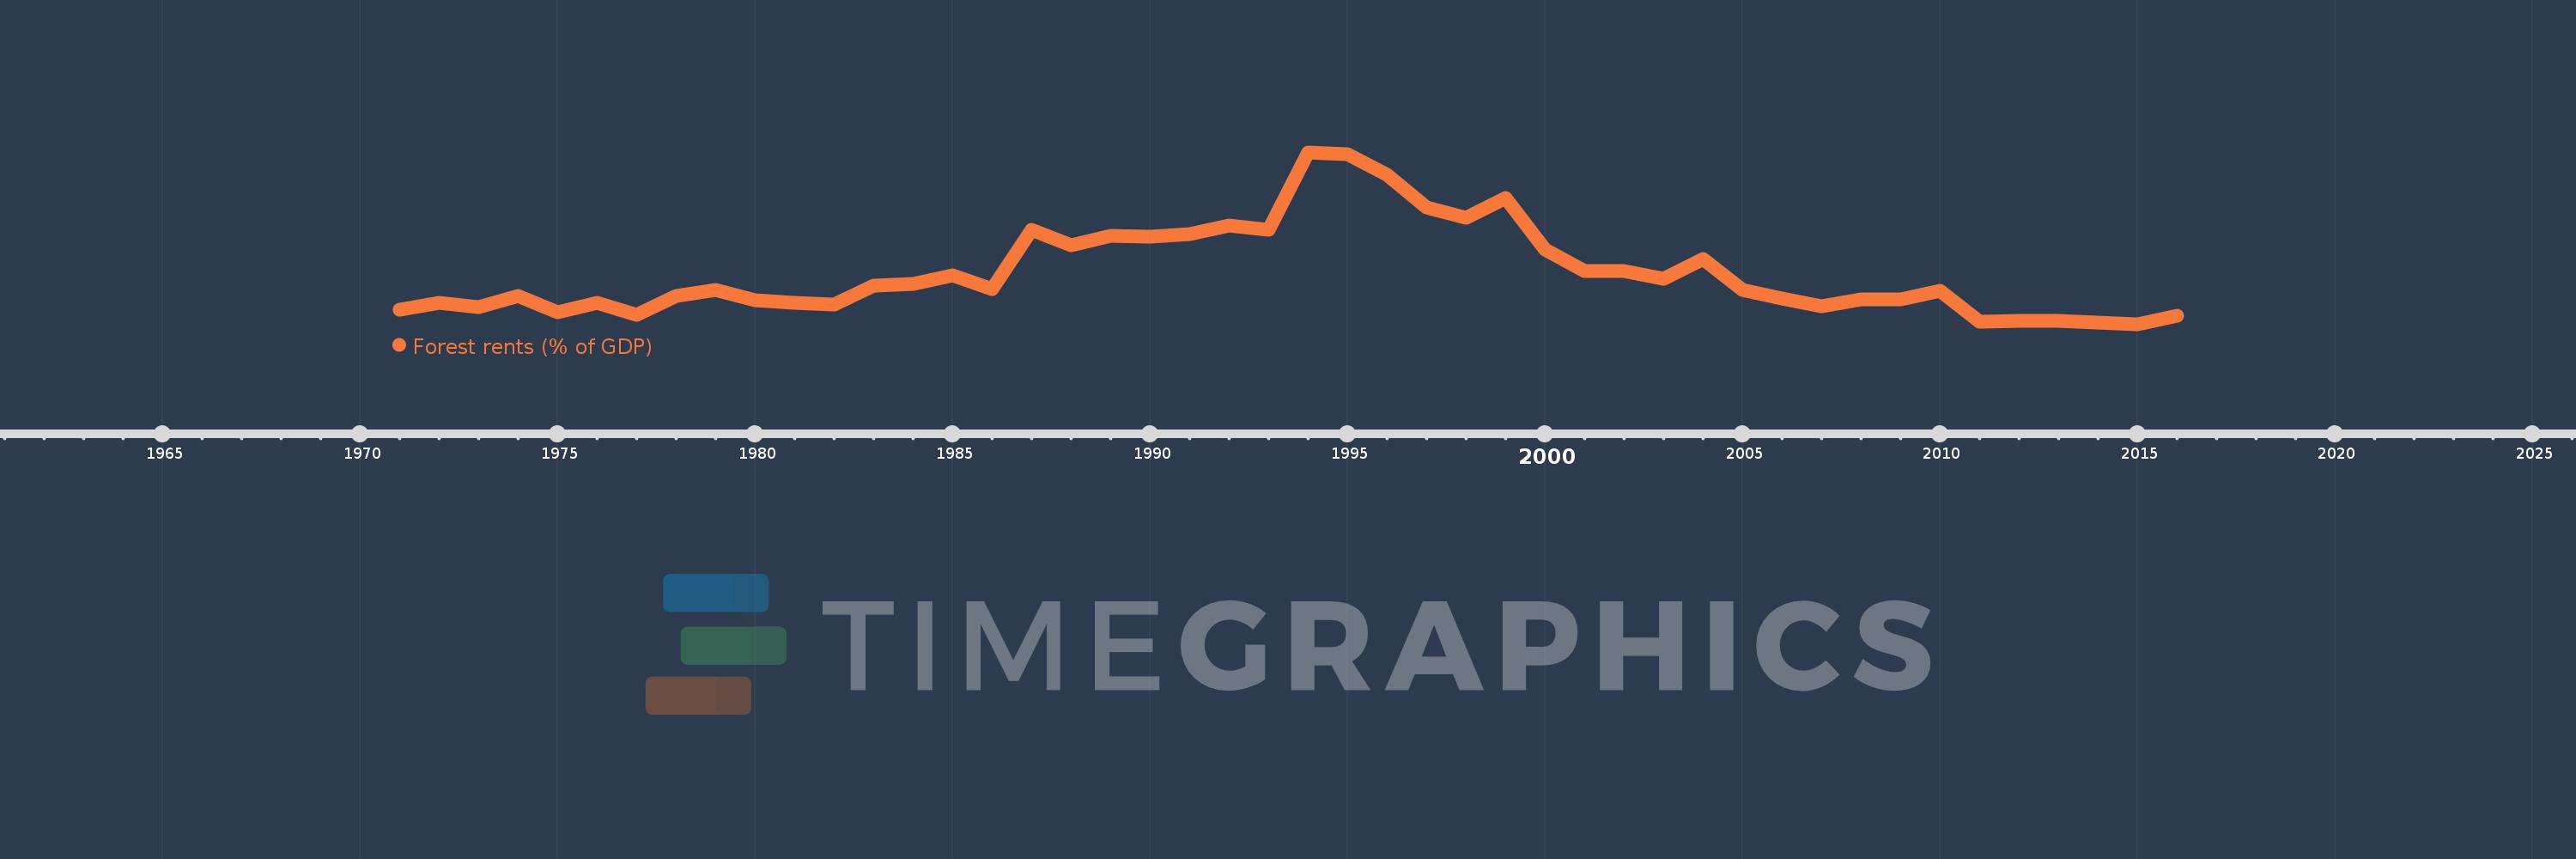
Forest rents (% of GDP)
2016,2015,2014,2013,2012,2011,2010,2009,2008,2007,2006,2005,2004,2003,2002,2001,2000,1999,1998,1997,1996,1995,1994,1993,1992,1991,1990,1989,1988,1987,1986,1985,1984,1983,1982,1981,1980,1979,1978,1977,1976,1975,1974,1973,1972,1971
This statistics in other country:
AfghanistanAlbaniaAlgeriaAndorraAngolaArab WorldArgentinaArmeniaArubaAustraliaAustriaAzerbaijanBahamas, TheBahrainBangladeshBarbadosBelarusBelgiumBelizeBeninBhutanBoliviaBosnia and HerzegovinaBotswanaBrazilBrunei DarussalamBulgariaBurkina FasoBurundiCabo VerdeCambodiaCameroonCanadaCaribbean small statesCentral African RepublicCentral Europe and the BalticsChadChileChinaColombiaComorosCongo, Dem. Rep.Congo, Rep.Costa RicaCote d'IvoireCroatiaCubaCyprusCzech RepublicDenmarkDjiboutiDominicaDominican RepublicEarly-demographic dividendEast Asia & PacificEast Asia & Pacific (excluding high income)East Asia & Pacific (IDA & IBRD countries)EcuadorEgypt, Arab Rep.El SalvadorEquatorial GuineaEritreaEstoniaEthiopiaEuro areaEurope & Central AsiaEurope & Central Asia (excluding high income)Europe & Central Asia (IDA & IBRD countries)European UnionFaroe IslandsFijiFinlandFragile and conflict affected situationsFranceFrench PolynesiaGabonGambia, TheGeorgiaGermanyGhanaGreeceGuatemalaGuineaGuinea-BissauGuyanaHaitiHeavily indebted poor countries (HIPC)High incomeHondurasHong Kong SAR, ChinaHungaryIBRD onlyIcelandIDA & IBRD totalIDA blendIDA onlyIDA totalIndiaIndonesiaIran, Islamic Rep.IraqIrelandIsraelItalyJamaicaJapanJordanKazakhstanKenyaKiribatiKorea, Rep.KuwaitKyrgyz RepublicLao PDRLate-demographic dividendLatin America & Caribbean Latin America & Caribbean (excluding high income)Latin America & the Caribbean (IDA & IBRD countries)LatviaLeast developed countries: UN classificationLebanonLesothoLiberiaLibyaLiechtensteinLithuaniaLow & middle incomeLow incomeLower middle incomeLuxembourgMacao SAR, ChinaMacedonia, FYRMadagascarMalawiMalaysiaMaldivesMaliMaltaMauritaniaMauritiusMexicoMicronesia, Fed. Sts.Middle East & North AfricaMiddle East & North Africa (excluding high income)Middle East & North Africa (IDA & IBRD countries)Middle incomeMoldovaMongoliaMontenegroMoroccoMozambiqueMyanmarNamibiaNepalNetherlandsNew CaledoniaNew ZealandNicaraguaNigerNigeriaNorth AmericaNorwayOECD membersOmanOther small statesPacific island small statesPakistanPanamaPapua New GuineaParaguayPeruPhilippinesPolandPortugalPost-demographic dividendPre-demographic dividendQatarRomaniaRussian FederationRwandaSamoaSao Tome and PrincipeSaudi ArabiaSenegalSerbiaSeychellesSierra LeoneSingaporeSlovak RepublicSloveniaSmall statesSolomon IslandsSomaliaSouth AfricaSouth AsiaSouth Asia (IDA & IBRD)South SudanSpainSri LankaSt. LuciaSt. Vincent and the GrenadinesSub-Saharan Africa Sub-Saharan Africa (excluding high income)Sub-Saharan Africa (IDA & IBRD countries)SudanSurinameSwazilandSwedenSwitzerlandSyrian Arab RepublicTajikistanTanzaniaThailandTimor-LesteTogoTongaTrinidad and TobagoTunisiaTurkeyTurkmenistanUgandaUkraineUnited Arab EmiratesUnited KingdomUnited StatesUpper middle incomeUruguayUzbekistanVanuatuVenezuela, RBVietnamWorldYemen, Rep.ZambiaZimbabwe Timeline:
This timeline shows a graph from 1971 to 2016 of Nigeria. No data until 1970. Number of actual observations by date: 46.
Source name:
World Development Indicators
Source organization:
Estimates based on sources and methods described in "The Changing Wealth of Nations: Measuring Sustainable Development in the New Millennium" (World Bank, 2011).
Categories, topics:
Environment
Last updated:
apr 23, 2017
Indicators value changes by year
At the date of observation
Value
Absolute change
Change from previous value
jan 1, 1971
1.637
+1.637
0.0%
jan 1, 1972
1.972
+0.335
20.49%
jan 1, 1973
1.733
-0.239
-12.11%
jan 1, 1974
2.292
+0.558
32.22%
jan 1, 1975
1.505
-0.787
-34.35%
jan 1, 1976
1.942
+0.438
29.11%
jan 1, 1977
1.378
-0.565
-29.07%
jan 1, 1978
2.272
+0.894
64.91%
jan 1, 1979
2.575
+0.303
13.34%
jan 1, 1980
2.079
-0.496
-19.26%
jan 1, 1981
1.944
-0.136
-6.53%
jan 1, 1982
1.867
-0.076
-3.92%
jan 1, 1983
2.783
+0.915
49.02%
jan 1, 1984
2.871
+0.088
3.16%
jan 1, 1985
3.278
+0.407
14.18%
jan 1, 1986
2.623
-0.655
-19.98%
jan 1, 1987
5.488
+2.865
109.24%
jan 1, 1988
4.732
-0.756
-13.78%
jan 1, 1989
5.173
+0.441
9.32%
jan 1, 1990
5.125
-0.047
-0.92%
jan 1, 1991
5.244
+0.119
2.32%
jan 1, 1992
5.681
+0.436
8.32%
jan 1, 1993
5.477
-0.204
-3.59%
jan 1, 1994
9.19
+3.713
67.79%
jan 1, 1995
9.11
-0.079
-0.86%
jan 1, 1996
8.108
-1.002
-11.0%
jan 1, 1997
6.533
-1.575
-19.42%
jan 1, 1998
6.042
-0.491
-7.52%
jan 1, 1999
6.985
+0.943
15.6%
jan 1, 2000
4.51
-2.474
-35.42%
jan 1, 2001
3.473
-1.037
-22.99%
jan 1, 2002
3.506
+0.033
0.94%
jan 1, 2003
3.129
-0.376
-10.74%
jan 1, 2004
4.049
+0.919
29.38%
jan 1, 2005
2.58
-1.469
-36.27%
jan 1, 2006
2.166
-0.414
-16.05%
jan 1, 2007
1.777
-0.389
-17.94%
jan 1, 2008
2.105
+0.328
18.45%
jan 1, 2009
2.132
+0.027
1.28%
jan 1, 2010
2.522
+0.39
18.3%
jan 1, 2011
1.061
-1.461
-57.94%
jan 1, 2012
1.08
+0.019
1.78%
jan 1, 2013
1.095
+0.015
1.41%
jan 1, 2014
1.0
-0.095
-8.67%
jan 1, 2015
0.931
-0.069
-6.91%
jan 1, 2016
1.32
+0.389
41.82%
Ranking of countries by current statistics by years


Comments: