29
/
en
AIzaSyAYiBZKx7MnpbEhh9jyipgxe19OcubqV5w
April 1, 2024
187778
Malaysia
MYS
true
2
1
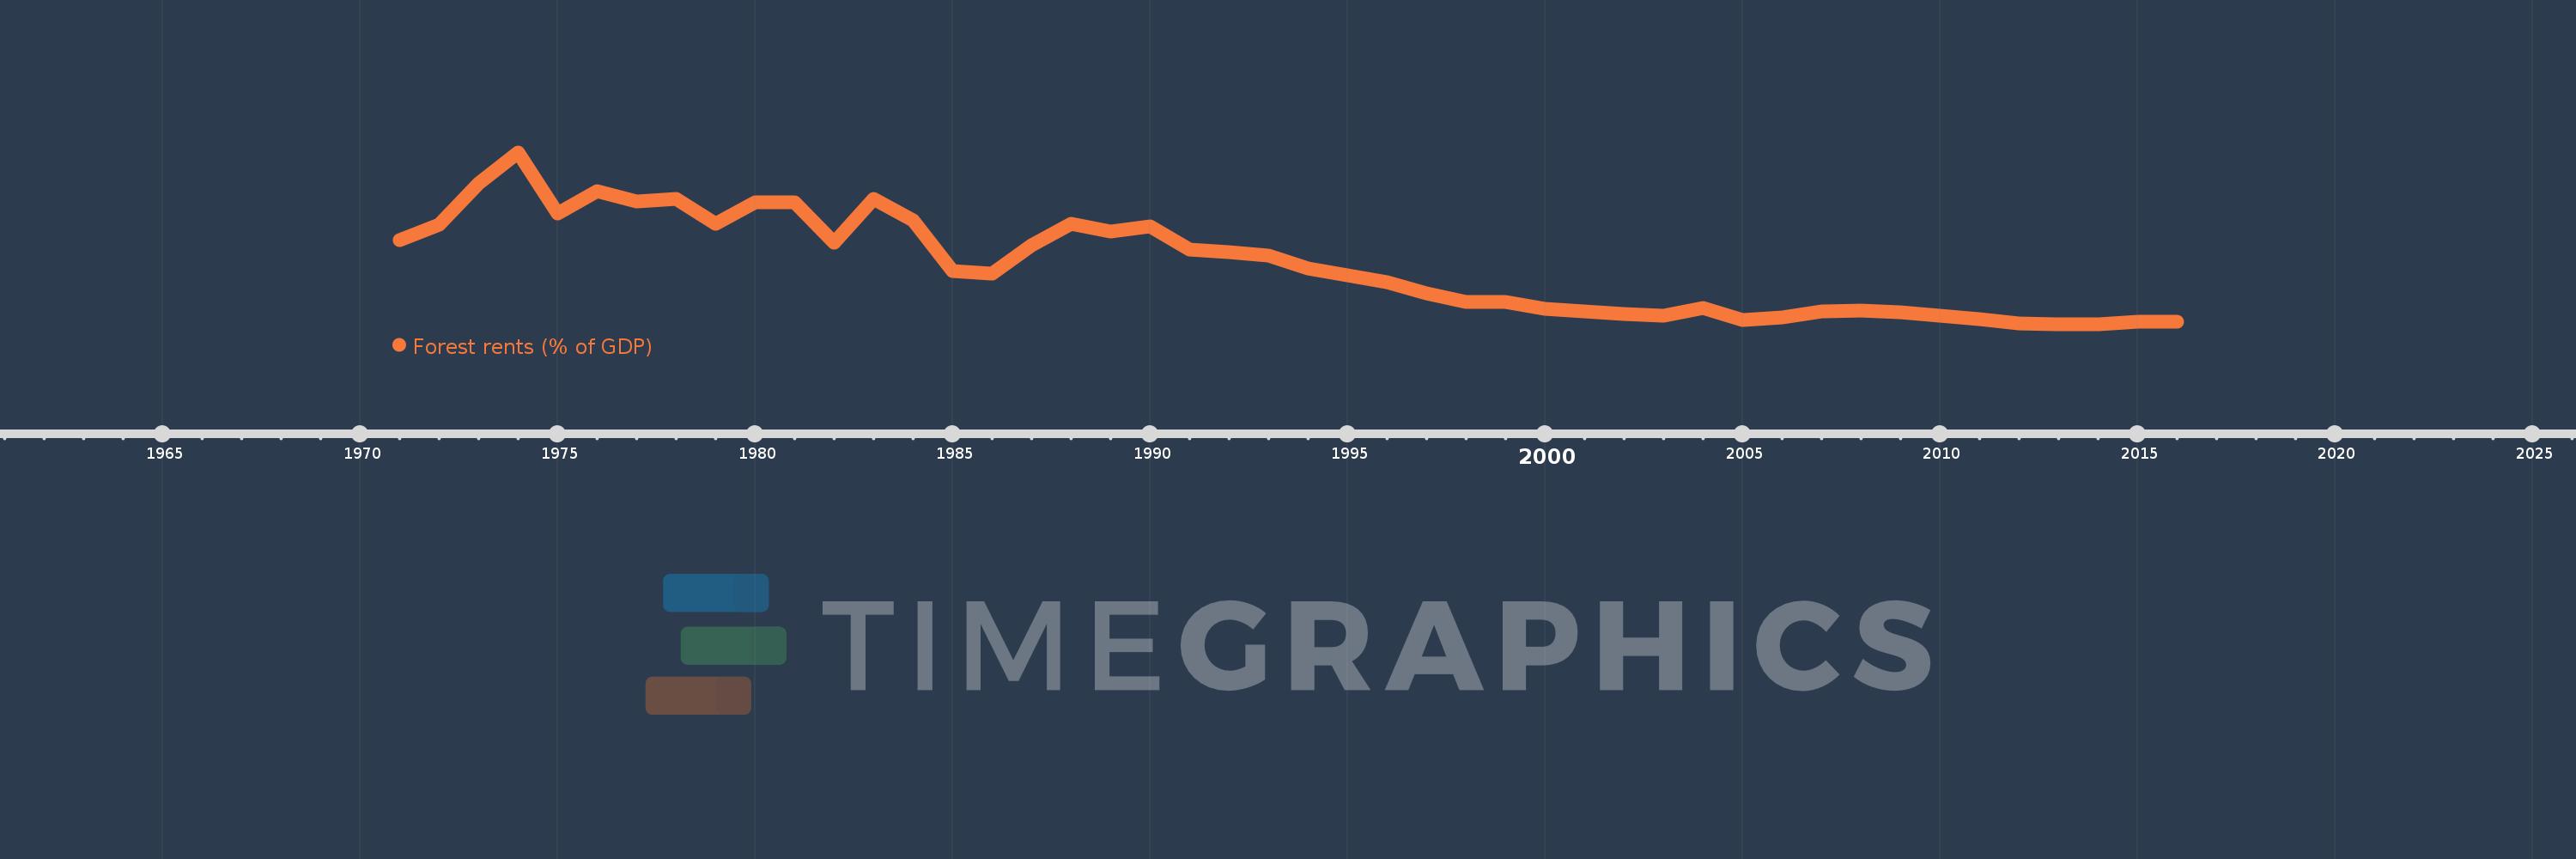
Forest rents (% of GDP)
2016,2015,2014,2013,2012,2011,2010,2009,2008,2007,2006,2005,2004,2003,2002,2001,2000,1999,1998,1997,1996,1995,1994,1993,1992,1991,1990,1989,1988,1987,1986,1985,1984,1983,1982,1981,1980,1979,1978,1977,1976,1975,1974,1973,1972,1971
This statistics in other country:
AfghanistanAlbaniaAlgeriaAndorraAngolaArab WorldArgentinaArmeniaArubaAustraliaAustriaAzerbaijanBahamas, TheBahrainBangladeshBarbadosBelarusBelgiumBelizeBeninBhutanBoliviaBosnia and HerzegovinaBotswanaBrazilBrunei DarussalamBulgariaBurkina FasoBurundiCabo VerdeCambodiaCameroonCanadaCaribbean small statesCentral African RepublicCentral Europe and the BalticsChadChileChinaColombiaComorosCongo, Dem. Rep.Congo, Rep.Costa RicaCote d'IvoireCroatiaCubaCyprusCzech RepublicDenmarkDjiboutiDominicaDominican RepublicEarly-demographic dividendEast Asia & PacificEast Asia & Pacific (excluding high income)East Asia & Pacific (IDA & IBRD countries)EcuadorEgypt, Arab Rep.El SalvadorEquatorial GuineaEritreaEstoniaEthiopiaEuro areaEurope & Central AsiaEurope & Central Asia (excluding high income)Europe & Central Asia (IDA & IBRD countries)European UnionFaroe IslandsFijiFinlandFragile and conflict affected situationsFranceFrench PolynesiaGabonGambia, TheGeorgiaGermanyGhanaGreeceGuatemalaGuineaGuinea-BissauGuyanaHaitiHeavily indebted poor countries (HIPC)High incomeHondurasHong Kong SAR, ChinaHungaryIBRD onlyIcelandIDA & IBRD totalIDA blendIDA onlyIDA totalIndiaIndonesiaIran, Islamic Rep.IraqIrelandIsraelItalyJamaicaJapanJordanKazakhstanKenyaKiribatiKorea, Rep.KuwaitKyrgyz RepublicLao PDRLate-demographic dividendLatin America & Caribbean Latin America & Caribbean (excluding high income)Latin America & the Caribbean (IDA & IBRD countries)LatviaLeast developed countries: UN classificationLebanonLesothoLiberiaLibyaLiechtensteinLithuaniaLow & middle incomeLow incomeLower middle incomeLuxembourgMacao SAR, ChinaMacedonia, FYRMadagascarMalawiMalaysiaMaldivesMaliMaltaMauritaniaMauritiusMexicoMicronesia, Fed. Sts.Middle East & North AfricaMiddle East & North Africa (excluding high income)Middle East & North Africa (IDA & IBRD countries)Middle incomeMoldovaMongoliaMontenegroMoroccoMozambiqueMyanmarNamibiaNepalNetherlandsNew CaledoniaNew ZealandNicaraguaNigerNigeriaNorth AmericaNorwayOECD membersOmanOther small statesPacific island small statesPakistanPanamaPapua New GuineaParaguayPeruPhilippinesPolandPortugalPost-demographic dividendPre-demographic dividendQatarRomaniaRussian FederationRwandaSamoaSao Tome and PrincipeSaudi ArabiaSenegalSerbiaSeychellesSierra LeoneSingaporeSlovak RepublicSloveniaSmall statesSolomon IslandsSomaliaSouth AfricaSouth AsiaSouth Asia (IDA & IBRD)South SudanSpainSri LankaSt. LuciaSt. Vincent and the GrenadinesSub-Saharan Africa Sub-Saharan Africa (excluding high income)Sub-Saharan Africa (IDA & IBRD countries)SudanSurinameSwazilandSwedenSwitzerlandSyrian Arab RepublicTajikistanTanzaniaThailandTimor-LesteTogoTongaTrinidad and TobagoTunisiaTurkeyTurkmenistanUgandaUkraineUnited Arab EmiratesUnited KingdomUnited StatesUpper middle incomeUruguayUzbekistanVanuatuVenezuela, RBVietnamWorldYemen, Rep.ZambiaZimbabwe Timeline:
This timeline shows a graph from 1971 to 2016 of Malaysia. No data until 1970. Number of actual observations by date: 46.
Source name:
World Development Indicators
Source organization:
Estimates based on sources and methods described in "The Changing Wealth of Nations: Measuring Sustainable Development in the New Millennium" (World Bank, 2011).
Categories, topics:
Environment
Last updated:
apr 23, 2017
Indicators value changes by year
Maximum:
31.872
jan 1, 1974
At the date of observation
Value
Absolute change
Change from previous value
jan 1, 1971
16.627
+16.627
0.0%
jan 1, 1972
19.338
+2.71
16.3%
jan 1, 1973
26.503
+7.165
37.05%
jan 1, 1974
31.872
+5.369
20.26%
jan 1, 1975
21.333
-10.539
-33.07%
jan 1, 1976
25.171
+3.838
17.99%
jan 1, 1977
23.369
-1.802
-7.16%
jan 1, 1978
23.817
+0.449
1.92%
jan 1, 1979
19.445
-4.372
-18.36%
jan 1, 1980
23.197
+3.752
19.3%
jan 1, 1981
23.189
-0.009
-0.04%
jan 1, 1982
16.19
-6.999
-30.18%
jan 1, 1983
23.831
+7.641
47.19%
jan 1, 1984
20.035
-3.796
-15.93%
jan 1, 1985
11.245
-8.79
-43.87%
jan 1, 1986
10.872
-0.373
-3.32%
jan 1, 1987
15.84
+4.968
45.69%
jan 1, 1988
19.5
+3.661
23.11%
jan 1, 1989
18.159
-1.341
-6.88%
jan 1, 1990
19.017
+0.858
4.72%
jan 1, 1991
15.108
-3.909
-20.56%
jan 1, 1992
14.558
-0.55
-3.64%
jan 1, 1993
14.068
-0.49
-3.37%
jan 1, 1994
11.807
-2.26
-16.07%
jan 1, 1995
10.556
-1.251
-10.59%
jan 1, 1996
9.333
-1.223
-11.59%
jan 1, 1997
7.384
-1.95
-20.89%
jan 1, 1998
5.891
-1.493
-20.22%
jan 1, 1999
5.972
+0.081
1.38%
jan 1, 2000
4.836
-1.136
-19.02%
jan 1, 2001
4.256
-0.58
-11.99%
jan 1, 2002
3.849
-0.407
-9.57%
jan 1, 2003
3.521
-0.328
-8.53%
jan 1, 2004
4.93
+1.409
40.02%
jan 1, 2005
2.893
-2.037
-41.32%
jan 1, 2006
3.344
+0.451
15.59%
jan 1, 2007
4.37
+1.026
30.69%
jan 1, 2008
4.512
+0.142
3.24%
jan 1, 2009
4.119
-0.393
-8.7%
jan 1, 2010
3.513
-0.606
-14.72%
jan 1, 2011
2.936
-0.577
-16.43%
jan 1, 2012
2.264
-0.672
-22.89%
jan 1, 2013
2.129
-0.135
-5.97%
jan 1, 2014
2.101
-0.028
-1.31%
jan 1, 2015
2.518
+0.417
19.87%
jan 1, 2016
2.573
+0.055
2.17%
Ranking of countries by current statistics by years


Comments: