30
/
AIzaSyAYiBZKx7MnpbEhh9jyipgxe19OcubqV5w
April 1, 2024
145658
Guinea
GIN
true
2
1
Forest rents (% of GDP)
2016,2015,2014,2013,2012,2011,2010,2009,2008,2007,2006,2005,2004,2003,2002,2001,2000,1999,1998,1997,1996,1995,1994,1993,1992,1991,1990,1989,1988,1987
Download
Global statistics library →Guinea →

Forest rents (% of GDP)

This statistics in other country:

AfghanistanAlbaniaAlgeriaAndorraAngolaArab WorldArgentinaArmeniaArubaAustraliaAustriaAzerbaijanBahamas, TheBahrainBangladeshBarbadosBelarusBelgiumBelizeBeninBhutanBoliviaBosnia and HerzegovinaBotswanaBrazilBrunei DarussalamBulgariaBurkina FasoBurundiCabo VerdeCambodiaCameroonCanadaCaribbean small statesCentral African RepublicCentral Europe and the BalticsChadChileChinaColombiaComorosCongo, Dem. Rep.Congo, Rep.Costa RicaCote d'IvoireCroatiaCubaCyprusCzech RepublicDenmarkDjiboutiDominicaDominican RepublicEarly-demographic dividendEast Asia & PacificEast Asia & Pacific (excluding high income)East Asia & Pacific (IDA & IBRD countries)EcuadorEgypt, Arab Rep.El SalvadorEquatorial GuineaEritreaEstoniaEthiopiaEuro areaEurope & Central AsiaEurope & Central Asia (excluding high income)Europe & Central Asia (IDA & IBRD countries)European UnionFaroe IslandsFijiFinlandFragile and conflict affected situationsFranceFrench PolynesiaGabonGambia, TheGeorgiaGermanyGhanaGreeceGuatemalaGuineaGuinea-BissauGuyanaHaitiHeavily indebted poor countries (HIPC)High incomeHondurasHong Kong SAR, ChinaHungaryIBRD onlyIcelandIDA & IBRD totalIDA blendIDA onlyIDA totalIndiaIndonesiaIran, Islamic Rep.IraqIrelandIsraelItalyJamaicaJapanJordanKazakhstanKenyaKiribatiKorea, Rep.KuwaitKyrgyz RepublicLao PDRLate-demographic dividendLatin America & Caribbean Latin America & Caribbean (excluding high income)Latin America & the Caribbean (IDA & IBRD countries)LatviaLeast developed countries: UN classificationLebanonLesothoLiberiaLibyaLiechtensteinLithuaniaLow & middle incomeLow incomeLower middle incomeLuxembourgMacao SAR, ChinaMacedonia, FYRMadagascarMalawiMalaysiaMaldivesMaliMaltaMauritaniaMauritiusMexicoMicronesia, Fed. Sts.Middle East & North AfricaMiddle East & North Africa (excluding high income)Middle East & North Africa (IDA & IBRD countries)Middle incomeMoldovaMongoliaMontenegroMoroccoMozambiqueMyanmarNamibiaNepalNetherlandsNew CaledoniaNew ZealandNicaraguaNigerNigeriaNorth AmericaNorwayOECD membersOmanOther small statesPacific island small statesPakistanPanamaPapua New GuineaParaguayPeruPhilippinesPolandPortugalPost-demographic dividendPre-demographic dividendQatarRomaniaRussian FederationRwandaSamoaSao Tome and PrincipeSaudi ArabiaSenegalSerbiaSeychellesSierra LeoneSingaporeSlovak RepublicSloveniaSmall statesSolomon IslandsSomaliaSouth AfricaSouth AsiaSouth Asia (IDA & IBRD)South SudanSpainSri LankaSt. LuciaSt. Vincent and the GrenadinesSub-Saharan Africa Sub-Saharan Africa (excluding high income)Sub-Saharan Africa (IDA & IBRD countries)SudanSurinameSwazilandSwedenSwitzerlandSyrian Arab RepublicTajikistanTanzaniaThailandTimor-LesteTogoTongaTrinidad and TobagoTunisiaTurkeyTurkmenistanUgandaUkraineUnited Arab EmiratesUnited KingdomUnited StatesUpper middle incomeUruguayUzbekistanVanuatuVenezuela, RBVietnamWorldYemen, Rep.ZambiaZimbabwe

Timeline:

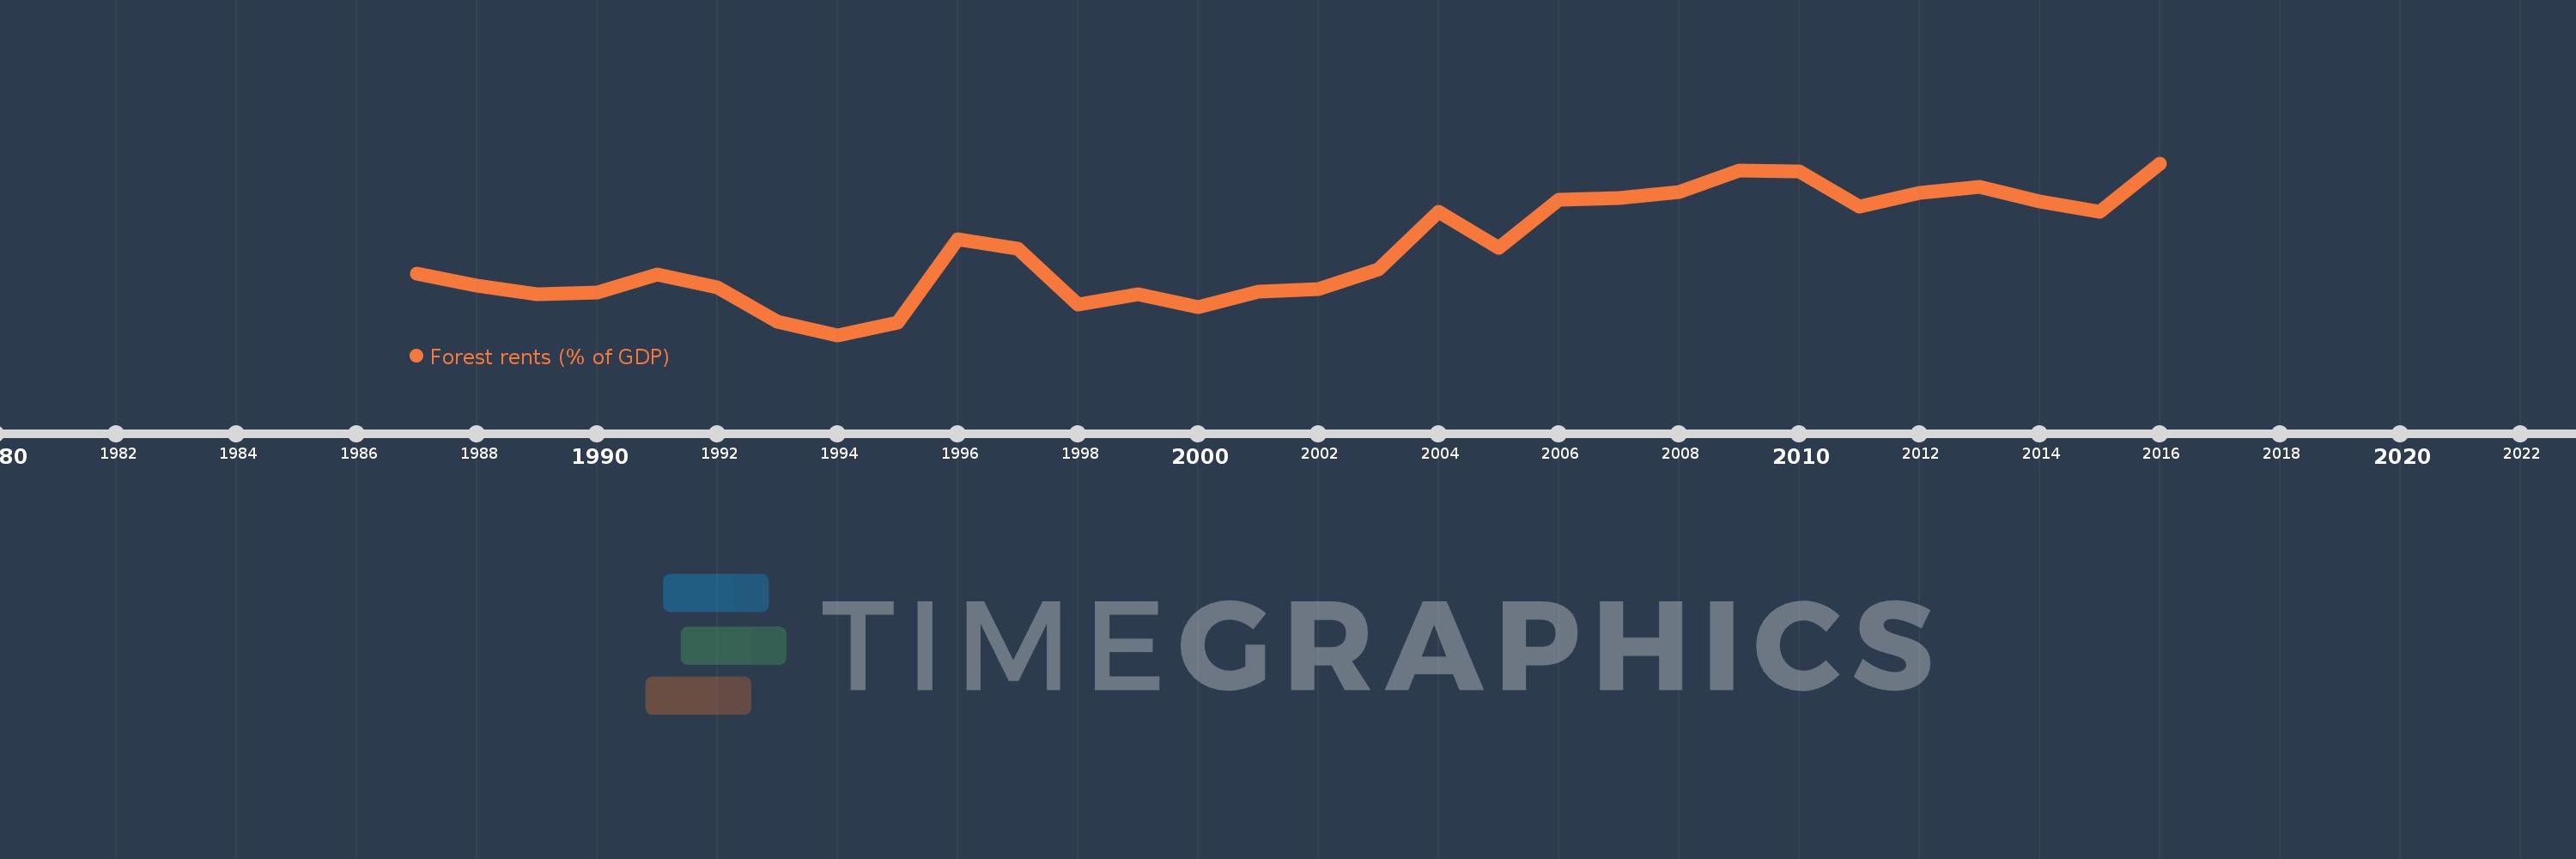
This timeline shows a graph from 1987 to 2016 of Guinea. No data until 1986. Number of actual observations by date: 30.

Source name:

World Development Indicators

Source organization:

Estimates based on sources and methods described in "The Changing Wealth of Nations: Measuring Sustainable Development in the New Millennium" (World Bank, 2011).

Categories, topics:

Environment

Last updated:

apr 23, 2017

Indicators value changes by year

Meaning:
9.928
Minimum:
4.909
jan 1, 1994
Maximum:
14.99
jan 1, 2016
At the date of observation
Value
Absolute change
Change from the previous value
jan 1, 1987
8.535
+8.535
0.0%
jan 1, 1988
7.815
-0.72
-8.44%
jan 1, 1989
7.298
-0.517
-6.61%
jan 1, 1990
7.386
+0.088
1.21%
jan 1, 1991
8.487
+1.101
14.9%
jan 1, 1992
7.683
-0.804
-9.47%
jan 1, 1993
5.667
-2.016
-26.24%
jan 1, 1994
4.909
-0.757
-13.37%
jan 1, 1995
5.647
+0.738
15.04%
jan 1, 1996
10.55
+4.903
86.82%
jan 1, 1997
9.997
-0.553
-5.24%
jan 1, 1998
6.718
-3.279
-32.8%
jan 1, 1999
7.28
+0.562
8.37%
jan 1, 2000
6.562
-0.718
-9.86%
jan 1, 2001
7.438
+0.876
13.35%
jan 1, 2002
7.598
+0.159
2.14%
jan 1, 2003
8.775
+1.177
15.5%
jan 1, 2004
12.162
+3.388
38.6%
jan 1, 2005
10.041
-2.121
-17.44%
jan 1, 2006
12.846
+2.804
27.93%
jan 1, 2007
12.933
+0.087
0.68%
jan 1, 2008
13.319
+0.386
2.98%
jan 1, 2009
14.54
+1.222
9.17%
jan 1, 2010
14.498
-0.043
-0.29%
jan 1, 2011
12.451
-2.047
-14.12%
jan 1, 2012
13.244
+0.794
6.37%
jan 1, 2013
13.609
+0.365
2.75%
jan 1, 2014
12.726
-0.883
-6.49%
jan 1, 2015
12.149
-0.577
-4.53%
jan 1, 2016
14.99
+2.84
23.38%

Ranking of countries by current statistics by years