29
/
en
AIzaSyAYiBZKx7MnpbEhh9jyipgxe19OcubqV5w
April 1, 2024
54063
Pacific island small states
PSS
false
2
1
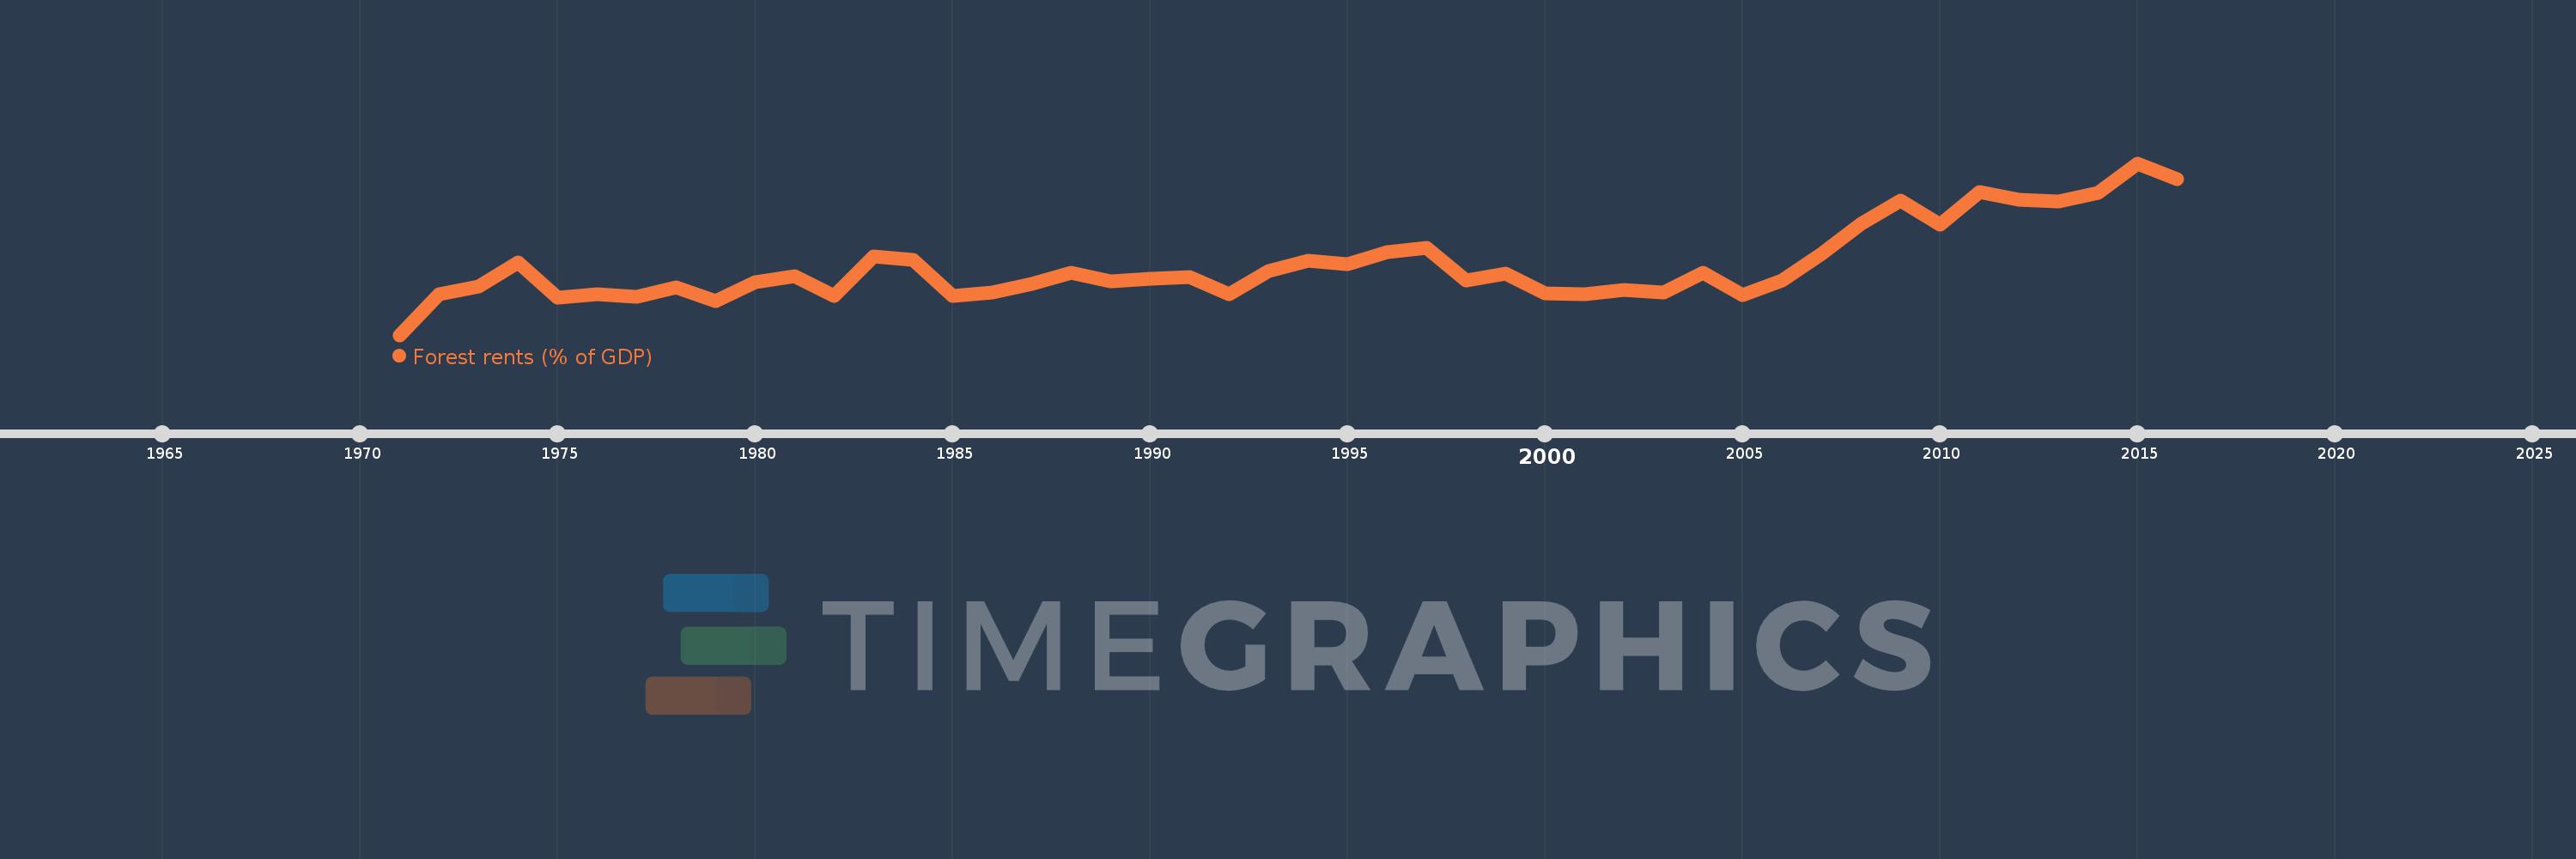
Forest rents (% of GDP)
2016,2015,2014,2013,2012,2011,2010,2009,2008,2007,2006,2005,2004,2003,2002,2001,2000,1999,1998,1997,1996,1995,1994,1993,1992,1991,1990,1989,1988,1987,1986,1985,1984,1983,1982,1981,1980,1979,1978,1977,1976,1975,1974,1973,1972,1971
This statistics in other country:
AfghanistanAlbaniaAlgeriaAndorraAngolaArab WorldArgentinaArmeniaArubaAustraliaAustriaAzerbaijanBahamas, TheBahrainBangladeshBarbadosBelarusBelgiumBelizeBeninBhutanBoliviaBosnia and HerzegovinaBotswanaBrazilBrunei DarussalamBulgariaBurkina FasoBurundiCabo VerdeCambodiaCameroonCanadaCaribbean small statesCentral African RepublicCentral Europe and the BalticsChadChileChinaColombiaComorosCongo, Dem. Rep.Congo, Rep.Costa RicaCote d'IvoireCroatiaCubaCyprusCzech RepublicDenmarkDjiboutiDominicaDominican RepublicEarly-demographic dividendEast Asia & PacificEast Asia & Pacific (excluding high income)East Asia & Pacific (IDA & IBRD countries)EcuadorEgypt, Arab Rep.El SalvadorEquatorial GuineaEritreaEstoniaEthiopiaEuro areaEurope & Central AsiaEurope & Central Asia (excluding high income)Europe & Central Asia (IDA & IBRD countries)European UnionFaroe IslandsFijiFinlandFragile and conflict affected situationsFranceFrench PolynesiaGabonGambia, TheGeorgiaGermanyGhanaGreeceGuatemalaGuineaGuinea-BissauGuyanaHaitiHeavily indebted poor countries (HIPC)High incomeHondurasHong Kong SAR, ChinaHungaryIBRD onlyIcelandIDA & IBRD totalIDA blendIDA onlyIDA totalIndiaIndonesiaIran, Islamic Rep.IraqIrelandIsraelItalyJamaicaJapanJordanKazakhstanKenyaKiribatiKorea, Rep.KuwaitKyrgyz RepublicLao PDRLate-demographic dividendLatin America & Caribbean Latin America & Caribbean (excluding high income)Latin America & the Caribbean (IDA & IBRD countries)LatviaLeast developed countries: UN classificationLebanonLesothoLiberiaLibyaLiechtensteinLithuaniaLow & middle incomeLow incomeLower middle incomeLuxembourgMacao SAR, ChinaMacedonia, FYRMadagascarMalawiMalaysiaMaldivesMaliMaltaMauritaniaMauritiusMexicoMicronesia, Fed. Sts.Middle East & North AfricaMiddle East & North Africa (excluding high income)Middle East & North Africa (IDA & IBRD countries)Middle incomeMoldovaMongoliaMontenegroMoroccoMozambiqueMyanmarNamibiaNepalNetherlandsNew CaledoniaNew ZealandNicaraguaNigerNigeriaNorth AmericaNorwayOECD membersOmanOther small statesPacific island small statesPakistanPanamaPapua New GuineaParaguayPeruPhilippinesPolandPortugalPost-demographic dividendPre-demographic dividendQatarRomaniaRussian FederationRwandaSamoaSao Tome and PrincipeSaudi ArabiaSenegalSerbiaSeychellesSierra LeoneSingaporeSlovak RepublicSloveniaSmall statesSolomon IslandsSomaliaSouth AfricaSouth AsiaSouth Asia (IDA & IBRD)South SudanSpainSri LankaSt. LuciaSt. Vincent and the GrenadinesSub-Saharan Africa Sub-Saharan Africa (excluding high income)Sub-Saharan Africa (IDA & IBRD countries)SudanSurinameSwazilandSwedenSwitzerlandSyrian Arab RepublicTajikistanTanzaniaThailandTimor-LesteTogoTongaTrinidad and TobagoTunisiaTurkeyTurkmenistanUgandaUkraineUnited Arab EmiratesUnited KingdomUnited StatesUpper middle incomeUruguayUzbekistanVanuatuVenezuela, RBVietnamWorldYemen, Rep.ZambiaZimbabwe Timeline:
This timeline shows a graph from 1971 to 2016 of Pacific island small states. No data until 1970. Number of actual observations by date: 46.
Source name:
World Development Indicators
Source organization:
Estimates based on sources and methods described in "The Changing Wealth of Nations: Measuring Sustainable Development in the New Millennium" (World Bank, 2011).
Categories, topics:
Environment
Last updated:
apr 23, 2017
Indicators value changes by year
At the date of observation
Value
Absolute change
Change from previous value
jan 1, 1971
0.322
+0.322
0.0%
jan 1, 1972
1.092
+0.77
239.53%
jan 1, 1973
1.25
+0.158
14.5%
jan 1, 1974
1.695
+0.445
35.6%
jan 1, 1975
1.036
-0.659
-38.87%
jan 1, 1976
1.1
+0.063
6.11%
jan 1, 1977
1.05
-0.05
-4.51%
jan 1, 1978
1.221
+0.171
16.26%
jan 1, 1979
0.965
-0.256
-20.97%
jan 1, 1980
1.324
+0.36
37.29%
jan 1, 1981
1.445
+0.12
9.07%
jan 1, 1982
1.072
-0.373
-25.79%
jan 1, 1983
1.824
+0.752
70.16%
jan 1, 1984
1.748
-0.076
-4.18%
jan 1, 1985
1.06
-0.688
-39.35%
jan 1, 1986
1.139
+0.079
7.46%
jan 1, 1987
1.302
+0.163
14.28%
jan 1, 1988
1.5
+0.198
15.23%
jan 1, 1989
1.344
-0.157
-10.44%
jan 1, 1990
1.388
+0.044
3.31%
jan 1, 1991
1.423
+0.035
2.52%
jan 1, 1992
1.103
-0.32
-22.47%
jan 1, 1993
1.542
+0.438
39.74%
jan 1, 1994
1.734
+0.193
12.5%
jan 1, 1995
1.674
-0.06
-3.46%
jan 1, 1996
1.892
+0.217
12.99%
jan 1, 1997
1.98
+0.088
4.64%
jan 1, 1998
1.367
-0.612
-30.93%
jan 1, 1999
1.483
+0.116
8.49%
jan 1, 2000
1.11
-0.373
-25.14%
jan 1, 2001
1.106
-0.004
-0.36%
jan 1, 2002
1.183
+0.076
6.88%
jan 1, 2003
1.137
-0.046
-3.86%
jan 1, 2004
1.507
+0.37
32.53%
jan 1, 2005
1.089
-0.418
-27.71%
jan 1, 2006
1.361
+0.272
24.94%
jan 1, 2007
1.874
+0.513
37.68%
jan 1, 2008
2.434
+0.56
29.88%
jan 1, 2009
2.876
+0.442
18.17%
jan 1, 2010
2.416
-0.46
-15.98%
jan 1, 2011
3.05
+0.634
26.23%
jan 1, 2012
2.894
-0.156
-5.12%
jan 1, 2013
2.862
-0.031
-1.09%
jan 1, 2014
3.032
+0.17
5.95%
jan 1, 2015
3.59
+0.557
18.37%
jan 1, 2016
3.284
-0.305
-8.5%
Ranking of countries by current statistics by years


Comments: