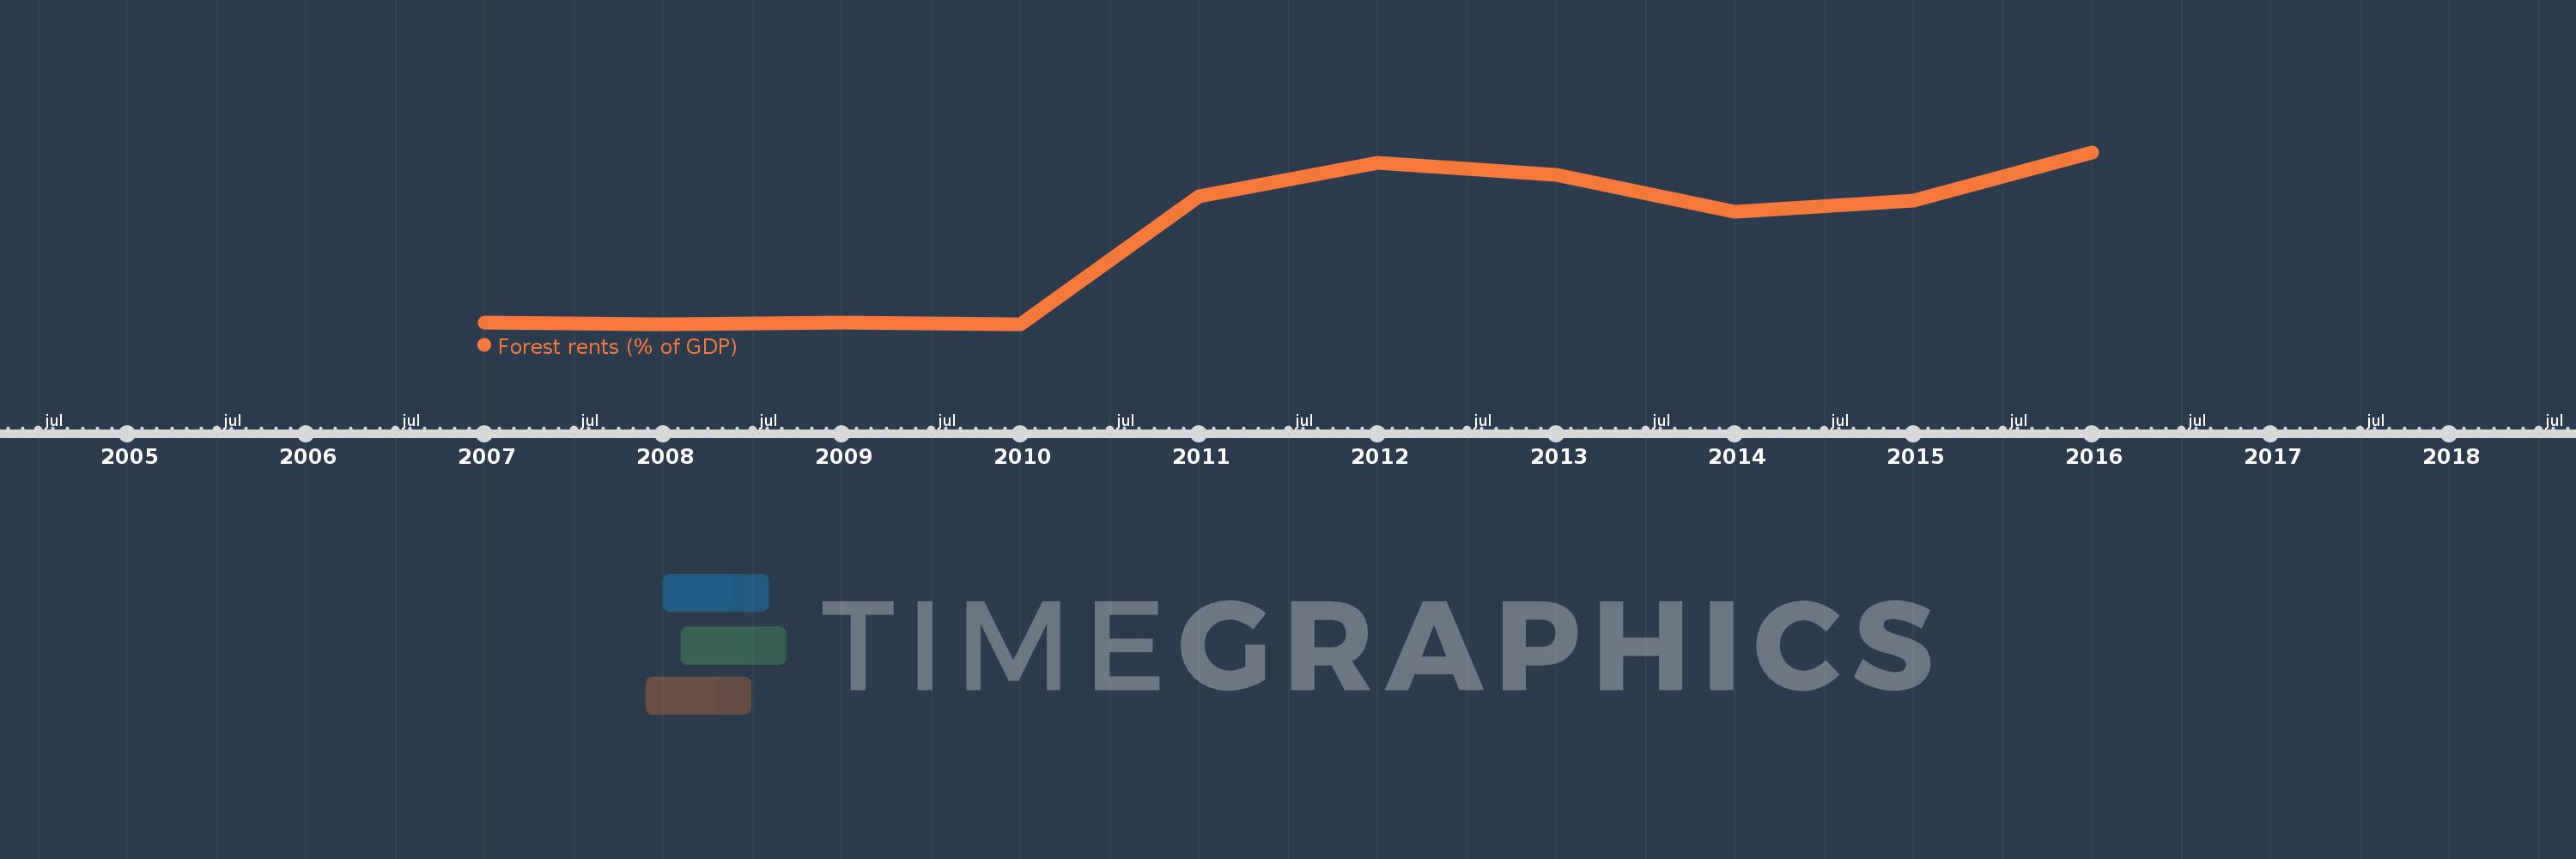
This timeline shows a graph from 2007 to 2016 of Serbia. No data until 2006. Number of actual observations by date: 10.
Source name:
World Development Indicators
Source organization:
Estimates based on sources and methods described in "The Changing Wealth of Nations: Measuring Sustainable Development in the New Millennium" (World Bank, 2011).
Categories, topics:
Environment
Last updated:
apr 23, 2017
Indicators value changes by year
Meaning:
0.302
Minimum:
0.176
jan 1, 2010
Maximum:
0.43
jan 1, 2016
At the date of observation
Value
Absolute change
Change from the previous value
jan 1, 2007
0.178
+0.178
0.0%
jan 1, 2008
0.176
-0.001
-0.72%
jan 1, 2009
0.178
+0.001
0.81%
jan 1, 2010
0.176
-0.002
-0.91%
jan 1, 2011
0.365
+0.189
107.1%
jan 1, 2012
0.415
+0.051
13.85%
jan 1, 2013
0.397
-0.018
-4.42%
jan 1, 2014
0.342
-0.055
-13.78%
jan 1, 2015
0.359
+0.017
4.96%
jan 1, 2016
0.43
+0.071
19.84%
Ranking of countries by current statistics by years
