30
/
AIzaSyAYiBZKx7MnpbEhh9jyipgxe19OcubqV5w
April 1, 2024
54065
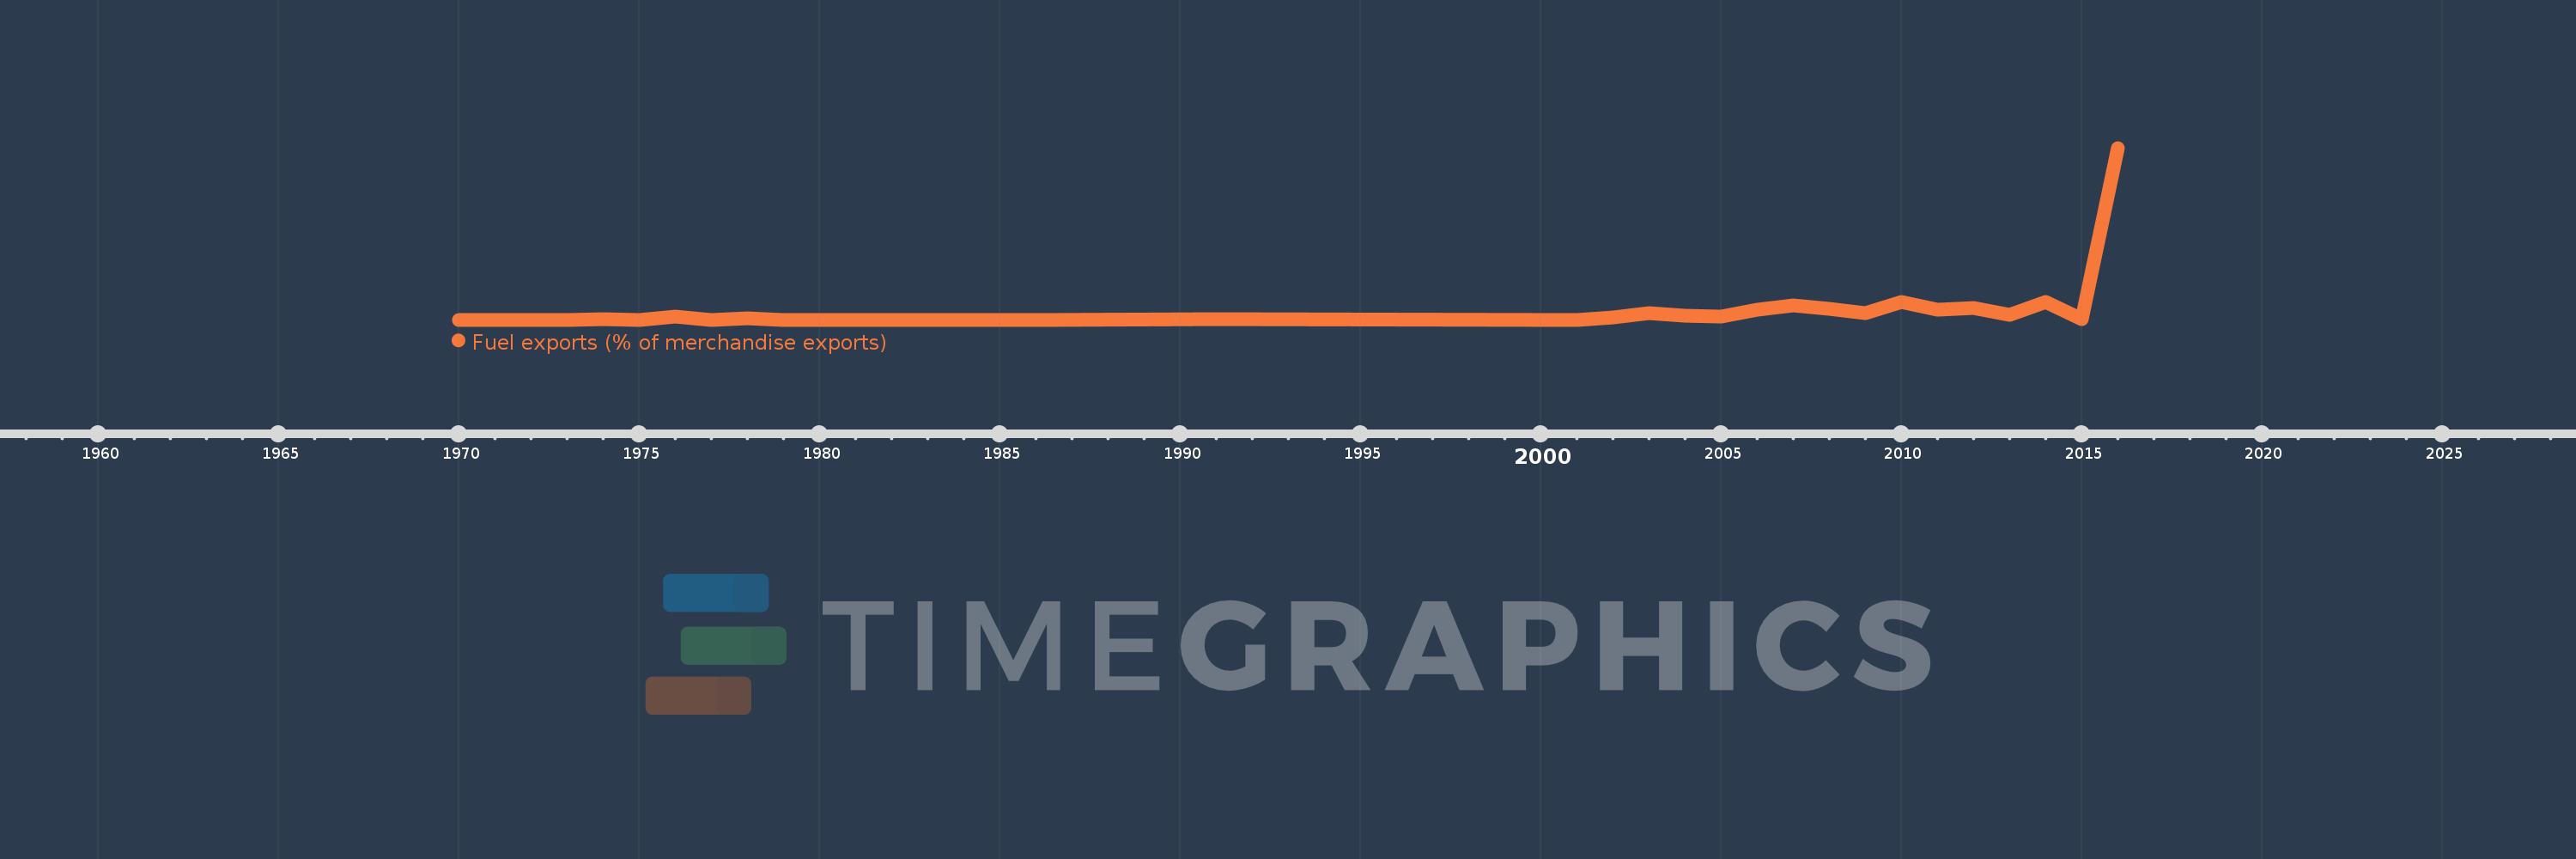
Pacific island small states
PSS
false
2
1
Fuel exports (% of merchandise exports)
2016,2015,2014,2013,2012,2011,2010,2009,2008,2007,2006,2005,2004,2003,2002,2001,1991,1986,1985,1984,1983,1982,1981,1979,1978,1977,1976,1975,1974,1973,1970
