29
/
en
AIzaSyAYiBZKx7MnpbEhh9jyipgxe19OcubqV5w
April 1, 2024
113574
Cote d'Ivoire
CIV
true
2
1
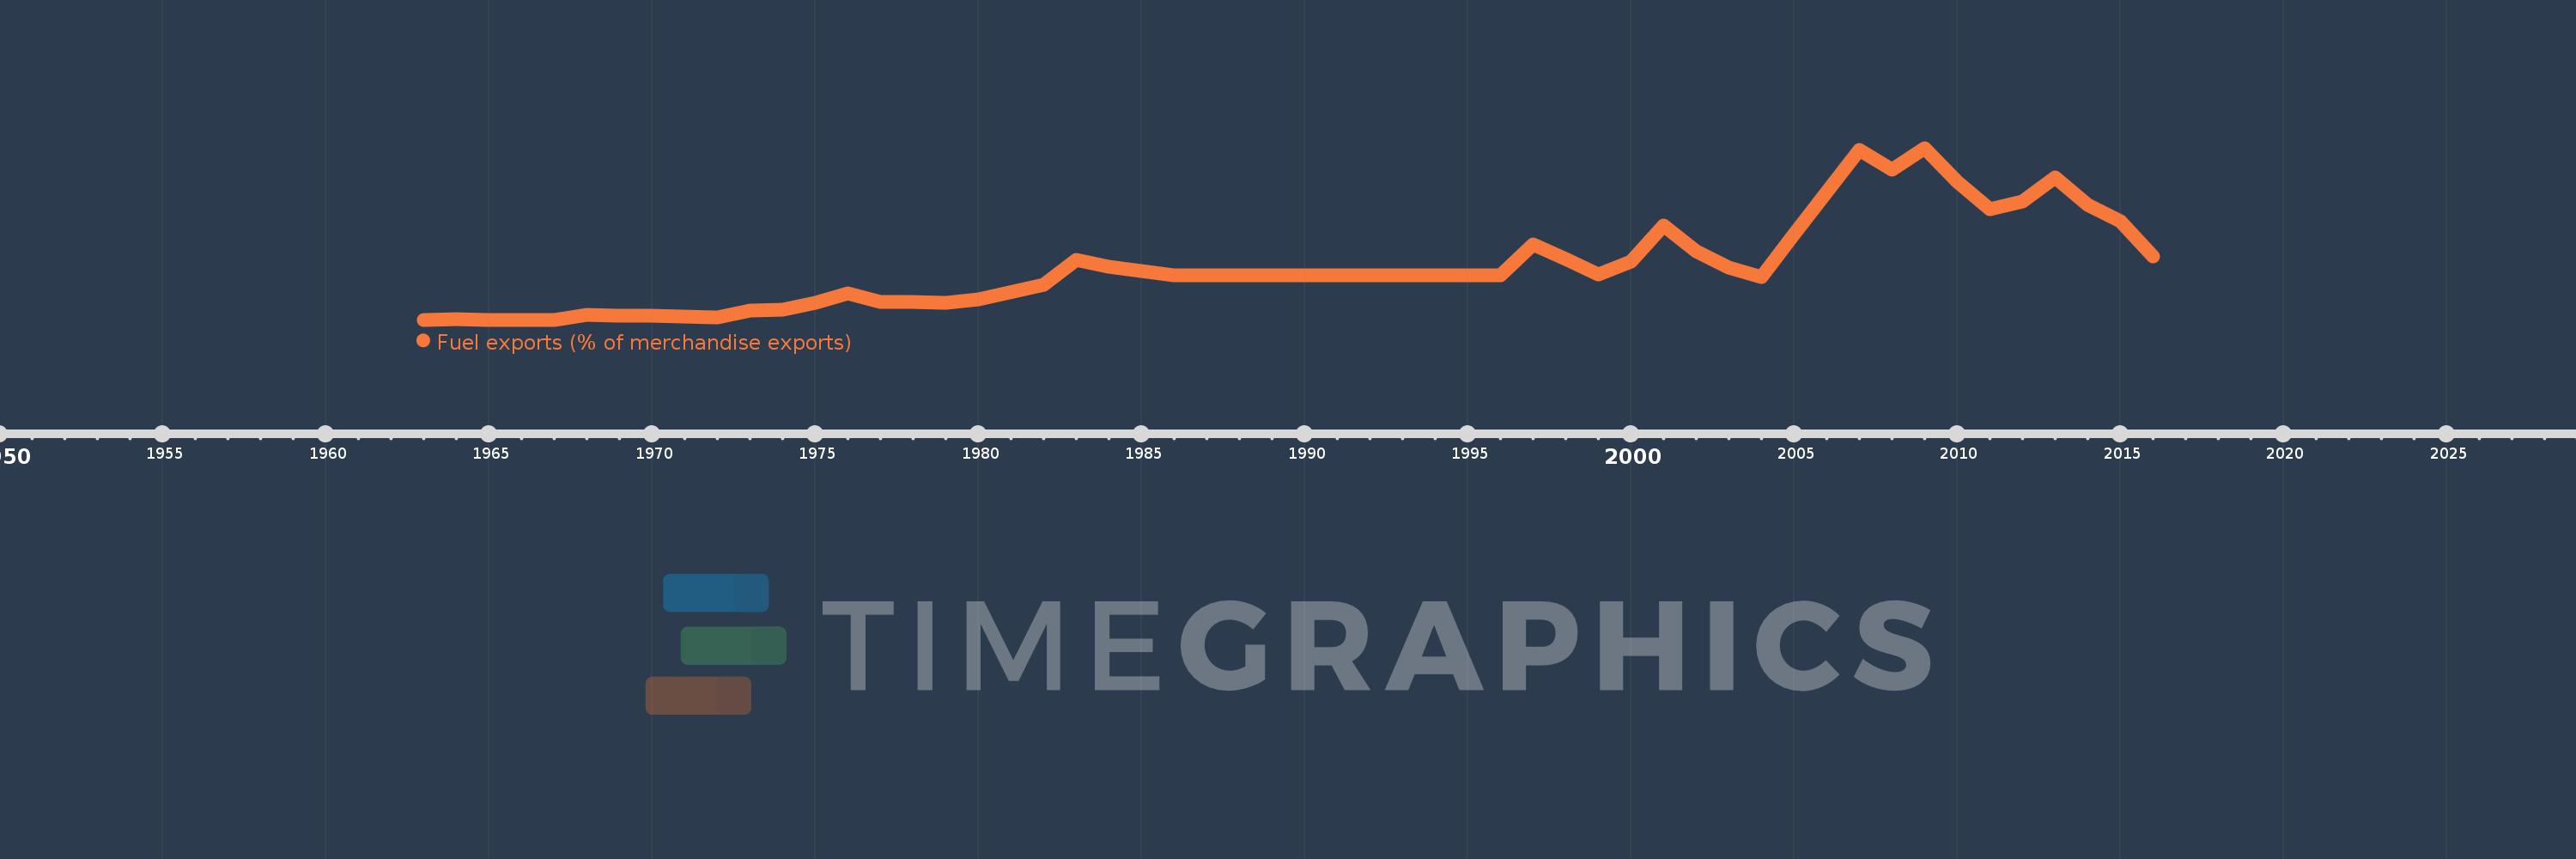
Fuel exports (% of merchandise exports)
2016,2015,2014,2013,2012,2011,2010,2009,2008,2007,2006,2005,2004,2003,2002,2001,2000,1999,1998,1997,1996,1986,1984,1983,1982,1980,1979,1978,1977,1976,1975,1974,1973,1972,1971,1970,1969,1968,1967,1966,1965,1964,1963
This statistics in other country:
AfghanistanAlbaniaAlgeriaAndorraAngolaAntigua and BarbudaArab WorldArgentinaArmeniaArubaAustraliaAustriaAzerbaijanBahamas, TheBahrainBangladeshBarbadosBelarusBelgiumBelizeBeninBermudaBhutanBoliviaBosnia and HerzegovinaBotswanaBrazilBrunei DarussalamBulgariaBurkina FasoBurundiCabo VerdeCambodiaCameroonCanadaCaribbean small statesCayman IslandsCentral African RepublicCentral Europe and the BalticsChadChileChinaColombiaComorosCongo, Dem. Rep.Congo, Rep.Costa RicaCote d'IvoireCroatiaCubaCyprusCzech RepublicDenmarkDjiboutiDominicaDominican RepublicEarly-demographic dividendEast Asia & PacificEast Asia & Pacific (excluding high income)East Asia & Pacific (IDA & IBRD countries)EcuadorEgypt, Arab Rep.El SalvadorEquatorial GuineaEritreaEstoniaEthiopiaEuro areaEurope & Central AsiaEurope & Central Asia (excluding high income)Europe & Central Asia (IDA & IBRD countries)European UnionFaroe IslandsFijiFinlandFragile and conflict affected situationsFranceFrench PolynesiaGabonGambia, TheGeorgiaGermanyGhanaGreeceGreenlandGrenadaGuatemalaGuineaGuinea-BissauGuyanaHaitiHeavily indebted poor countries (HIPC)High incomeHondurasHong Kong SAR, ChinaHungaryIBRD onlyIcelandIDA & IBRD totalIDA blendIDA onlyIDA totalIndiaIndonesiaIran, Islamic Rep.IraqIrelandIsraelItalyJamaicaJapanJordanKazakhstanKenyaKiribatiKorea, Rep.KuwaitKyrgyz RepublicLao PDRLate-demographic dividendLatin America & Caribbean Latin America & Caribbean (excluding high income)Latin America & the Caribbean (IDA & IBRD countries)LatviaLeast developed countries: UN classificationLebanonLesothoLiberiaLibyaLithuaniaLow & middle incomeLower middle incomeLuxembourgMacao SAR, ChinaMacedonia, FYRMadagascarMalawiMalaysiaMaldivesMaliMaltaMauritaniaMauritiusMexicoMiddle East & North AfricaMiddle East & North Africa (excluding high income)Middle East & North Africa (IDA & IBRD countries)Middle incomeMoldovaMongoliaMoroccoMozambiqueMyanmarNamibiaNepalNetherlandsNew CaledoniaNew ZealandNicaraguaNigerNigeriaNorth AmericaNorwayOECD membersOmanOther small statesPacific island small statesPakistanPalauPanamaPapua New GuineaParaguayPeruPhilippinesPolandPortugalPost-demographic dividendPre-demographic dividendQatarRomaniaRussian FederationRwandaSamoaSao Tome and PrincipeSaudi ArabiaSenegalSerbiaSeychellesSierra LeoneSingaporeSlovak RepublicSloveniaSmall statesSolomon IslandsSomaliaSouth AfricaSouth AsiaSouth Asia (IDA & IBRD)SpainSri LankaSt. Kitts and NevisSt. LuciaSt. Vincent and the GrenadinesSub-Saharan Africa Sub-Saharan Africa (excluding high income)Sub-Saharan Africa (IDA & IBRD countries)SudanSurinameSwazilandSwedenSwitzerlandSyrian Arab RepublicTajikistanTanzaniaThailandTimor-LesteTogoTongaTrinidad and TobagoTunisiaTurkeyTurkmenistanTurks and Caicos IslandsTuvaluUgandaUkraineUnited Arab EmiratesUnited KingdomUnited StatesUpper middle incomeUruguayVanuatuVenezuela, RBVietnamVirgin Islands (U.S.)WorldYemen, Rep.ZambiaZimbabwe Timeline:
This timeline shows a graph from 1963 to 2016 of Cote d'Ivoire. No data until 1962. Number of actual observations by date: 43.
Source name:
World Development Indicators
Source organization:
World Bank staff estimates from the Comtrade database maintained by the United Nations Statistics Division.
Categories, topics:
Energy & Mining, Private Sector, Trade
Last updated:
apr 23, 2017
Indicators value changes by year
Maximum:
37.382
jan 1, 2009
At the date of observation
Value
Absolute change
Change from previous value
jan 1, 1963
0.003
+0.003
0.0%
jan 1, 1964
0.077
+0.074
2.35K%
jan 1, 1965
0.003
-0.074
-95.87%
jan 1, 1966
0.01
+0.007
219.29%
jan 1, 1967
0.012
+0.002
19.24%
jan 1, 1968
1.145
+1.133
9.4K%
jan 1, 1969
0.905
-0.24
-21.0%
jan 1, 1970
0.891
-0.013
-1.48%
jan 1, 1971
0.619
-0.272
-30.5%
jan 1, 1972
0.541
-0.079
-12.68%
jan 1, 1973
2.071
+1.53
282.76%
jan 1, 1974
2.278
+0.208
10.04%
jan 1, 1975
3.731
+1.453
63.75%
jan 1, 1976
5.659
+1.929
51.69%
jan 1, 1977
3.863
-1.797
-31.74%
jan 1, 1978
3.802
-0.06
-1.57%
jan 1, 1979
3.701
-0.102
-2.68%
jan 1, 1980
4.484
+0.784
21.18%
jan 1, 1982
7.543
+3.058
68.2%
jan 1, 1983
13.026
+5.483
72.7%
jan 1, 1984
11.451
-1.575
-12.09%
jan 1, 1986
9.708
-1.744
-15.23%
jan 1, 1996
9.597
-0.111
-1.14%
jan 1, 1997
16.338
+6.742
70.25%
jan 1, 1998
13.202
-3.136
-19.2%
jan 1, 1999
9.855
-3.347
-25.35%
jan 1, 2000
12.7
+2.846
28.88%
jan 1, 2001
20.518
+7.818
61.56%
jan 1, 2002
14.966
-5.552
-27.06%
jan 1, 2003
11.432
-3.534
-23.61%
jan 1, 2004
9.325
-2.107
-18.43%
jan 1, 2005
18.566
+9.241
99.09%
jan 1, 2006
27.81
+9.243
49.79%
jan 1, 2007
36.989
+9.18
33.01%
jan 1, 2008
32.71
-4.279
-11.57%
jan 1, 2009
37.382
+4.672
14.28%
jan 1, 2010
29.983
-7.399
-19.79%
jan 1, 2011
24.086
-5.897
-19.67%
jan 1, 2012
25.66
+1.574
6.53%
jan 1, 2013
30.919
+5.259
20.49%
jan 1, 2014
25.017
-5.902
-19.09%
jan 1, 2015
21.456
-3.561
-14.23%
jan 1, 2016
13.796
-7.66
-35.7%
Ranking of countries by current statistics by years


Comments: