29
/
en
AIzaSyAYiBZKx7MnpbEhh9jyipgxe19OcubqV5w
April 1, 2024
30674
Europe & Central Asia
ECS
false
2
1
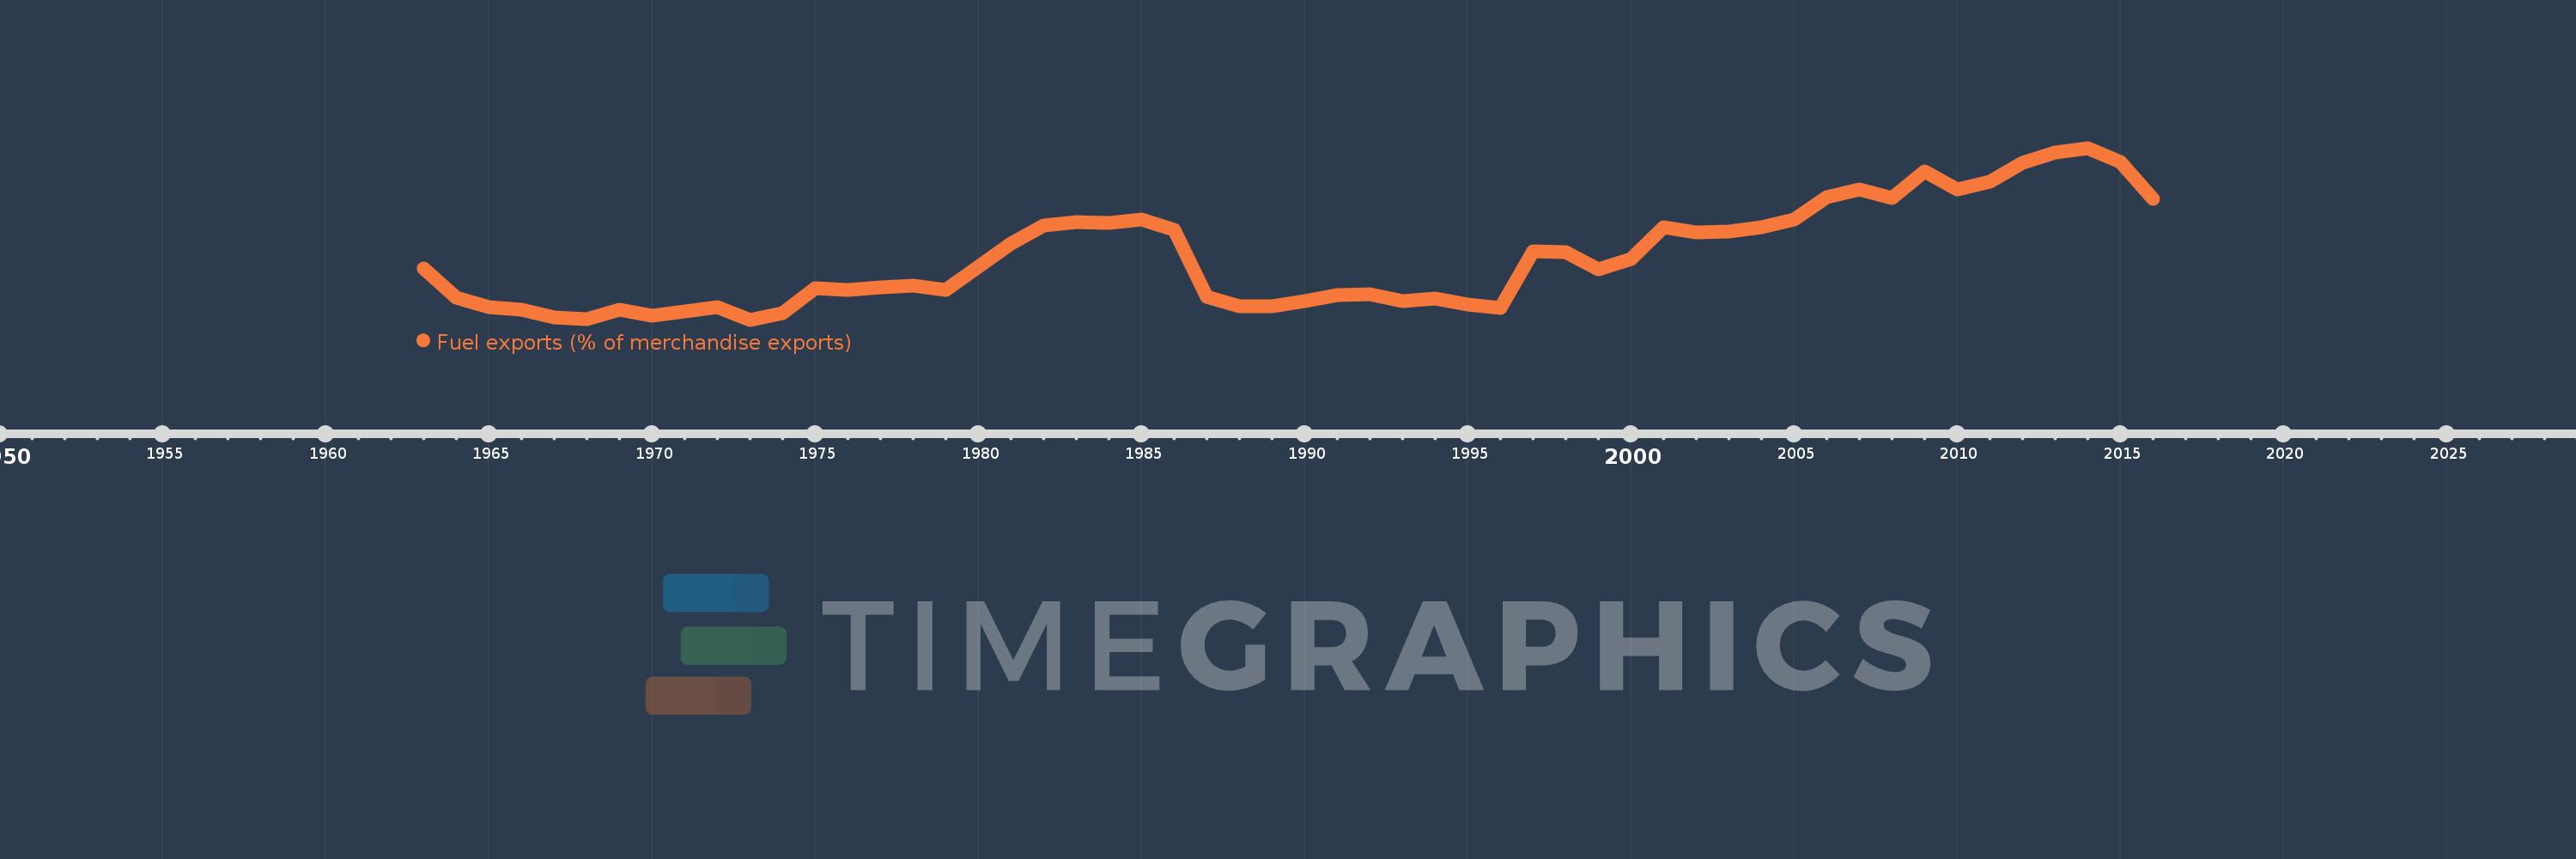
Fuel exports (% of merchandise exports)
2016,2015,2014,2013,2012,2011,2010,2009,2008,2007,2006,2005,2004,2003,2002,2001,2000,1999,1998,1997,1996,1995,1994,1993,1992,1991,1990,1989,1988,1987,1986,1985,1984,1983,1982,1981,1980,1979,1978,1977,1976,1975,1974,1973,1972,1971,1970,1969,1968,1967,1966,1965,1964,1963
This statistics in other country:
AfghanistanAlbaniaAlgeriaAndorraAngolaAntigua and BarbudaArab WorldArgentinaArmeniaArubaAustraliaAustriaAzerbaijanBahamas, TheBahrainBangladeshBarbadosBelarusBelgiumBelizeBeninBermudaBhutanBoliviaBosnia and HerzegovinaBotswanaBrazilBrunei DarussalamBulgariaBurkina FasoBurundiCabo VerdeCambodiaCameroonCanadaCaribbean small statesCayman IslandsCentral African RepublicCentral Europe and the BalticsChadChileChinaColombiaComorosCongo, Dem. Rep.Congo, Rep.Costa RicaCote d'IvoireCroatiaCubaCyprusCzech RepublicDenmarkDjiboutiDominicaDominican RepublicEarly-demographic dividendEast Asia & PacificEast Asia & Pacific (excluding high income)East Asia & Pacific (IDA & IBRD countries)EcuadorEgypt, Arab Rep.El SalvadorEquatorial GuineaEritreaEstoniaEthiopiaEuro areaEurope & Central AsiaEurope & Central Asia (excluding high income)Europe & Central Asia (IDA & IBRD countries)European UnionFaroe IslandsFijiFinlandFragile and conflict affected situationsFranceFrench PolynesiaGabonGambia, TheGeorgiaGermanyGhanaGreeceGreenlandGrenadaGuatemalaGuineaGuinea-BissauGuyanaHaitiHeavily indebted poor countries (HIPC)High incomeHondurasHong Kong SAR, ChinaHungaryIBRD onlyIcelandIDA & IBRD totalIDA blendIDA onlyIDA totalIndiaIndonesiaIran, Islamic Rep.IraqIrelandIsraelItalyJamaicaJapanJordanKazakhstanKenyaKiribatiKorea, Rep.KuwaitKyrgyz RepublicLao PDRLate-demographic dividendLatin America & Caribbean Latin America & Caribbean (excluding high income)Latin America & the Caribbean (IDA & IBRD countries)LatviaLeast developed countries: UN classificationLebanonLesothoLiberiaLibyaLithuaniaLow & middle incomeLower middle incomeLuxembourgMacao SAR, ChinaMacedonia, FYRMadagascarMalawiMalaysiaMaldivesMaliMaltaMauritaniaMauritiusMexicoMiddle East & North AfricaMiddle East & North Africa (excluding high income)Middle East & North Africa (IDA & IBRD countries)Middle incomeMoldovaMongoliaMoroccoMozambiqueMyanmarNamibiaNepalNetherlandsNew CaledoniaNew ZealandNicaraguaNigerNigeriaNorth AmericaNorwayOECD membersOmanOther small statesPacific island small statesPakistanPalauPanamaPapua New GuineaParaguayPeruPhilippinesPolandPortugalPost-demographic dividendPre-demographic dividendQatarRomaniaRussian FederationRwandaSamoaSao Tome and PrincipeSaudi ArabiaSenegalSerbiaSeychellesSierra LeoneSingaporeSlovak RepublicSloveniaSmall statesSolomon IslandsSomaliaSouth AfricaSouth AsiaSouth Asia (IDA & IBRD)SpainSri LankaSt. Kitts and NevisSt. LuciaSt. Vincent and the GrenadinesSub-Saharan Africa Sub-Saharan Africa (excluding high income)Sub-Saharan Africa (IDA & IBRD countries)SudanSurinameSwazilandSwedenSwitzerlandSyrian Arab RepublicTajikistanTanzaniaThailandTimor-LesteTogoTongaTrinidad and TobagoTunisiaTurkeyTurkmenistanTurks and Caicos IslandsTuvaluUgandaUkraineUnited Arab EmiratesUnited KingdomUnited StatesUpper middle incomeUruguayVanuatuVenezuela, RBVietnamVirgin Islands (U.S.)WorldYemen, Rep.ZambiaZimbabwe Timeline:
This timeline shows a graph from 1963 to 2016 of Europe & Central Asia. No data until 1962. Number of actual observations by date: 54.
Source name:
World Development Indicators
Source organization:
World Bank staff estimates from the Comtrade database maintained by the United Nations Statistics Division.
Categories, topics:
Energy & Mining, Private Sector, Trade
Last updated:
apr 23, 2017
Indicators value changes by year
Maximum:
13.821
jan 1, 2014
At the date of observation
Value
Absolute change
Change from previous value
jan 1, 1963
6.525
+6.525
0.0%
jan 1, 1964
4.764
-1.761
-26.99%
jan 1, 1965
4.218
-0.546
-11.47%
jan 1, 1966
4.035
-0.182
-4.33%
jan 1, 1967
3.603
-0.432
-10.72%
jan 1, 1968
3.492
-0.111
-3.08%
jan 1, 1969
4.046
+0.554
15.87%
jan 1, 1970
3.698
-0.348
-8.61%
jan 1, 1971
3.942
+0.244
6.61%
jan 1, 1972
4.206
+0.264
6.69%
jan 1, 1973
3.45
-0.756
-17.98%
jan 1, 1974
3.835
+0.385
11.16%
jan 1, 1975
5.347
+1.513
39.44%
jan 1, 1976
5.234
-0.113
-2.11%
jan 1, 1977
5.39
+0.155
2.97%
jan 1, 1978
5.52
+0.13
2.42%
jan 1, 1979
5.229
-0.291
-5.27%
jan 1, 1980
6.648
+1.419
27.13%
jan 1, 1981
8.05
+1.402
21.1%
jan 1, 1982
9.114
+1.063
13.21%
jan 1, 1983
9.331
+0.217
2.38%
jan 1, 1984
9.31
-0.021
-0.22%
jan 1, 1985
9.478
+0.168
1.81%
jan 1, 1986
8.857
-0.621
-6.55%
jan 1, 1987
4.849
-4.008
-45.25%
jan 1, 1988
4.285
-0.564
-11.64%
jan 1, 1989
4.258
-0.026
-0.61%
jan 1, 1990
4.565
+0.307
7.2%
jan 1, 1991
4.933
+0.368
8.07%
jan 1, 1992
5.0
+0.066
1.35%
jan 1, 1993
4.583
-0.417
-8.33%
jan 1, 1994
4.723
+0.14
3.05%
jan 1, 1995
4.376
-0.347
-7.35%
jan 1, 1996
4.175
-0.201
-4.59%
jan 1, 1997
7.557
+3.382
81.02%
jan 1, 1998
7.535
-0.023
-0.3%
jan 1, 1999
6.469
-1.066
-14.15%
jan 1, 2000
7.096
+0.627
9.69%
jan 1, 2001
9.024
+1.928
27.17%
jan 1, 2002
8.714
-0.31
-3.43%
jan 1, 2003
8.754
+0.039
0.45%
jan 1, 2004
9.058
+0.305
3.48%
jan 1, 2005
9.478
+0.42
4.64%
jan 1, 2006
10.844
+1.366
14.41%
jan 1, 2007
11.292
+0.448
4.13%
jan 1, 2008
10.816
-0.476
-4.21%
jan 1, 2009
12.392
+1.576
14.57%
jan 1, 2010
11.296
-1.097
-8.85%
jan 1, 2011
11.808
+0.512
4.53%
jan 1, 2012
12.922
+1.114
9.44%
jan 1, 2013
13.543
+0.62
4.8%
jan 1, 2014
13.821
+0.278
2.05%
jan 1, 2015
12.954
-0.866
-6.27%
jan 1, 2016
10.727
-2.227
-17.19%
Ranking of countries by current statistics by years


Comments: