29
/
en
AIzaSyAYiBZKx7MnpbEhh9jyipgxe19OcubqV5w
April 1, 2024
269318
Turkey
TUR
true
2
1
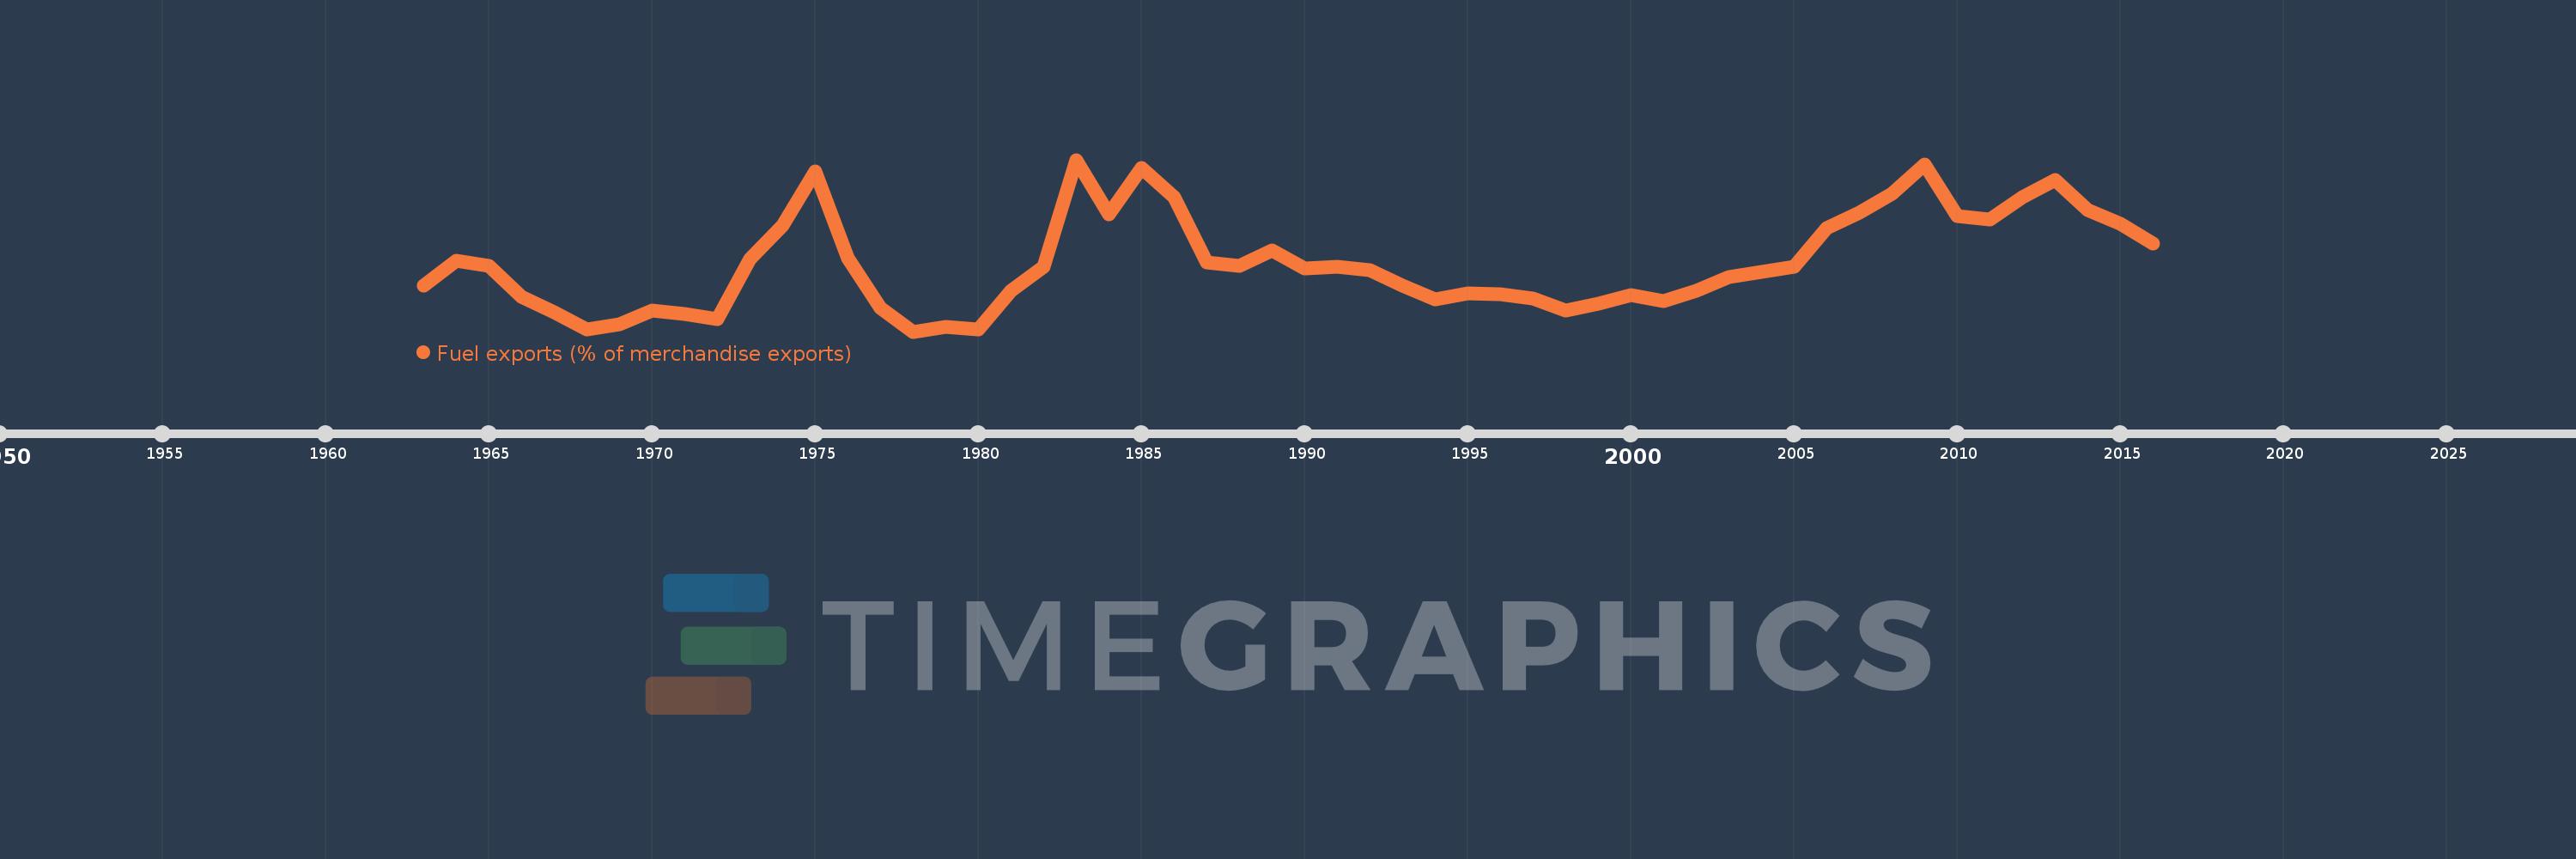
Fuel exports (% of merchandise exports)
2016,2015,2014,2013,2012,2011,2010,2009,2008,2007,2006,2005,2004,2003,2002,2001,2000,1999,1998,1997,1996,1995,1994,1993,1992,1991,1990,1989,1988,1987,1986,1985,1984,1983,1982,1981,1980,1979,1978,1977,1976,1975,1974,1973,1972,1971,1970,1969,1968,1967,1966,1965,1964,1963
This statistics in other country:
AfghanistanAlbaniaAlgeriaAndorraAngolaAntigua and BarbudaArab WorldArgentinaArmeniaArubaAustraliaAustriaAzerbaijanBahamas, TheBahrainBangladeshBarbadosBelarusBelgiumBelizeBeninBermudaBhutanBoliviaBosnia and HerzegovinaBotswanaBrazilBrunei DarussalamBulgariaBurkina FasoBurundiCabo VerdeCambodiaCameroonCanadaCaribbean small statesCayman IslandsCentral African RepublicCentral Europe and the BalticsChadChileChinaColombiaComorosCongo, Dem. Rep.Congo, Rep.Costa RicaCote d'IvoireCroatiaCubaCyprusCzech RepublicDenmarkDjiboutiDominicaDominican RepublicEarly-demographic dividendEast Asia & PacificEast Asia & Pacific (excluding high income)East Asia & Pacific (IDA & IBRD countries)EcuadorEgypt, Arab Rep.El SalvadorEquatorial GuineaEritreaEstoniaEthiopiaEuro areaEurope & Central AsiaEurope & Central Asia (excluding high income)Europe & Central Asia (IDA & IBRD countries)European UnionFaroe IslandsFijiFinlandFragile and conflict affected situationsFranceFrench PolynesiaGabonGambia, TheGeorgiaGermanyGhanaGreeceGreenlandGrenadaGuatemalaGuineaGuinea-BissauGuyanaHaitiHeavily indebted poor countries (HIPC)High incomeHondurasHong Kong SAR, ChinaHungaryIBRD onlyIcelandIDA & IBRD totalIDA blendIDA onlyIDA totalIndiaIndonesiaIran, Islamic Rep.IraqIrelandIsraelItalyJamaicaJapanJordanKazakhstanKenyaKiribatiKorea, Rep.KuwaitKyrgyz RepublicLao PDRLate-demographic dividendLatin America & Caribbean Latin America & Caribbean (excluding high income)Latin America & the Caribbean (IDA & IBRD countries)LatviaLeast developed countries: UN classificationLebanonLesothoLiberiaLibyaLithuaniaLow & middle incomeLower middle incomeLuxembourgMacao SAR, ChinaMacedonia, FYRMadagascarMalawiMalaysiaMaldivesMaliMaltaMauritaniaMauritiusMexicoMiddle East & North AfricaMiddle East & North Africa (excluding high income)Middle East & North Africa (IDA & IBRD countries)Middle incomeMoldovaMongoliaMoroccoMozambiqueMyanmarNamibiaNepalNetherlandsNew CaledoniaNew ZealandNicaraguaNigerNigeriaNorth AmericaNorwayOECD membersOmanOther small statesPacific island small statesPakistanPalauPanamaPapua New GuineaParaguayPeruPhilippinesPolandPortugalPost-demographic dividendPre-demographic dividendQatarRomaniaRussian FederationRwandaSamoaSao Tome and PrincipeSaudi ArabiaSenegalSerbiaSeychellesSierra LeoneSingaporeSlovak RepublicSloveniaSmall statesSolomon IslandsSomaliaSouth AfricaSouth AsiaSouth Asia (IDA & IBRD)SpainSri LankaSt. Kitts and NevisSt. LuciaSt. Vincent and the GrenadinesSub-Saharan Africa Sub-Saharan Africa (excluding high income)Sub-Saharan Africa (IDA & IBRD countries)SudanSurinameSwazilandSwedenSwitzerlandSyrian Arab RepublicTajikistanTanzaniaThailandTimor-LesteTogoTongaTrinidad and TobagoTunisiaTurkeyTurkmenistanTurks and Caicos IslandsTuvaluUgandaUkraineUnited Arab EmiratesUnited KingdomUnited StatesUpper middle incomeUruguayVanuatuVenezuela, RBVietnamVirgin Islands (U.S.)WorldYemen, Rep.ZambiaZimbabwe Timeline:
This timeline shows a graph from 1963 to 2016 of Turkey. No data until 1962. Number of actual observations by date: 54.
Source name:
World Development Indicators
Source organization:
World Bank staff estimates from the Comtrade database maintained by the United Nations Statistics Division.
Categories, topics:
Energy & Mining, Private Sector, Trade
Last updated:
apr 23, 2017
Indicators value changes by year
At the date of observation
Value
Absolute change
Change from previous value
jan 1, 1963
1.616
+1.616
0.0%
jan 1, 1964
2.486
+0.87
53.83%
jan 1, 1965
2.286
-0.201
-8.07%
jan 1, 1966
1.23
-1.056
-46.18%
jan 1, 1967
0.682
-0.548
-44.53%
jan 1, 1968
0.086
-0.597
-87.45%
jan 1, 1969
0.269
+0.183
213.82%
jan 1, 1970
0.74
+0.471
175.41%
jan 1, 1971
0.623
-0.117
-15.78%
jan 1, 1972
0.436
-0.187
-30.0%
jan 1, 1973
2.525
+2.089
478.89%
jan 1, 1974
3.715
+1.19
47.12%
jan 1, 1975
5.586
+1.871
50.35%
jan 1, 1976
2.573
-3.013
-53.94%
jan 1, 1977
0.827
-1.746
-67.87%
jan 1, 1978
0.004
-0.823
-99.51%
jan 1, 1979
0.156
+0.152
3.77K%
jan 1, 1980
0.092
-0.064
-40.91%
jan 1, 1981
1.428
+1.336
1.45K%
jan 1, 1982
2.281
+0.853
59.77%
jan 1, 1983
6.0
+3.719
163.04%
jan 1, 1984
4.108
-1.892
-31.54%
jan 1, 1985
5.704
+1.596
38.86%
jan 1, 1986
4.682
-1.022
-17.93%
jan 1, 1987
2.423
-2.258
-48.24%
jan 1, 1988
2.291
-0.132
-5.47%
jan 1, 1989
2.849
+0.558
24.36%
jan 1, 1990
2.2
-0.649
-22.77%
jan 1, 1991
2.267
+0.067
3.04%
jan 1, 1992
2.146
-0.121
-5.35%
jan 1, 1993
1.594
-0.552
-25.71%
jan 1, 1994
1.137
-0.457
-28.69%
jan 1, 1995
1.33
+0.193
16.98%
jan 1, 1996
1.299
-0.031
-2.31%
jan 1, 1997
1.169
-0.13
-9.99%
jan 1, 1998
0.74
-0.429
-36.68%
jan 1, 1999
0.972
+0.232
31.32%
jan 1, 2000
1.274
+0.301
30.99%
jan 1, 2001
1.063
-0.21
-16.52%
jan 1, 2002
1.419
+0.356
33.44%
jan 1, 2003
1.921
+0.502
35.41%
jan 1, 2004
2.08
+0.159
8.29%
jan 1, 2005
2.274
+0.193
9.29%
jan 1, 2006
3.608
+1.334
58.66%
jan 1, 2007
4.171
+0.564
15.63%
jan 1, 2008
4.819
+0.648
15.53%
jan 1, 2009
5.849
+1.03
21.37%
jan 1, 2010
4.024
-1.824
-31.19%
jan 1, 2011
3.905
-0.12
-2.98%
jan 1, 2012
4.699
+0.795
20.35%
jan 1, 2013
5.285
+0.586
12.47%
jan 1, 2014
4.258
-1.027
-19.43%
jan 1, 2015
3.762
-0.496
-11.65%
jan 1, 2016
3.083
-0.679
-18.04%
Ranking of countries by current statistics by years


Comments: