29
/
en
AIzaSyAYiBZKx7MnpbEhh9jyipgxe19OcubqV5w
April 1, 2024
152519
Hungary
HUN
true
2
1
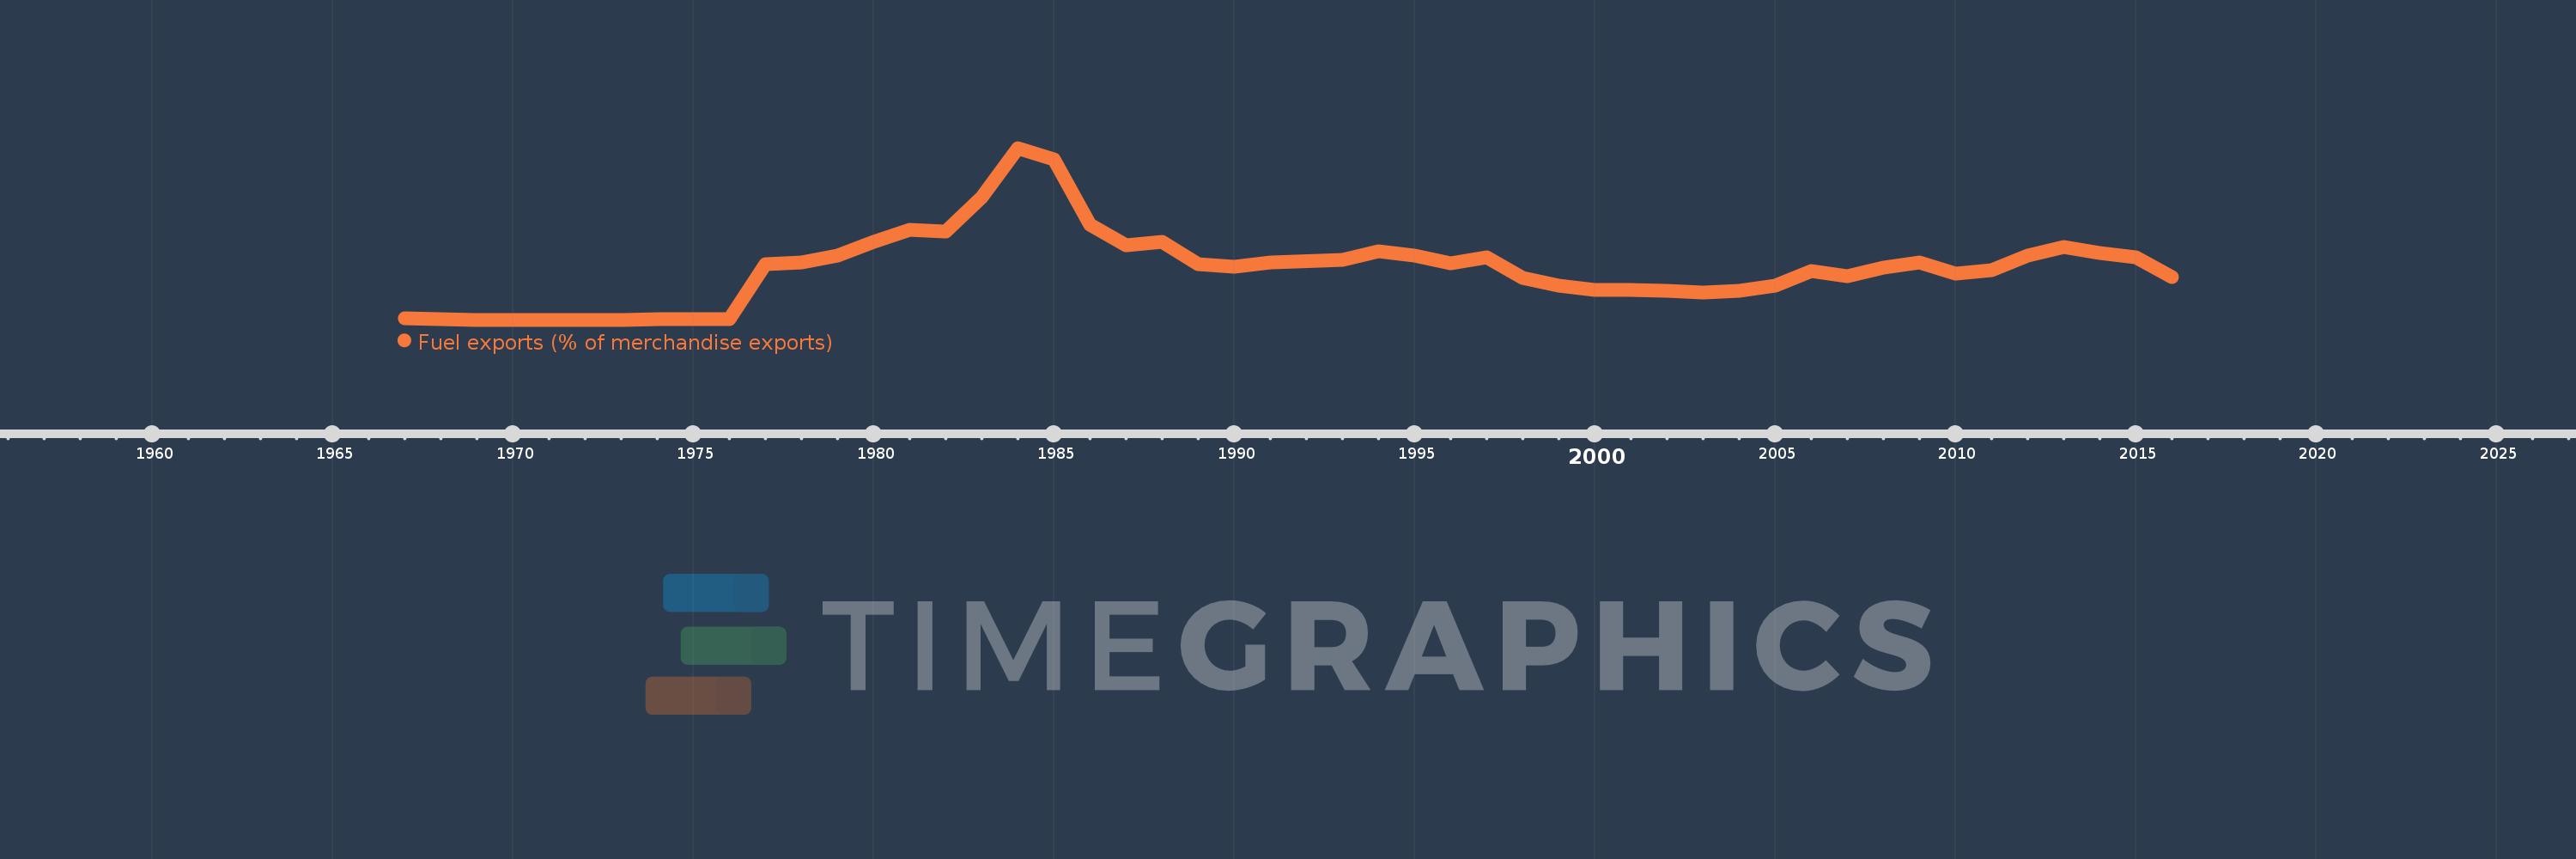
Fuel exports (% of merchandise exports)
2016,2015,2014,2013,2012,2011,2010,2009,2008,2007,2006,2005,2004,2003,2002,2001,2000,1999,1998,1997,1996,1995,1994,1993,1991,1990,1989,1988,1987,1986,1985,1984,1983,1982,1981,1980,1979,1978,1977,1976,1975,1974,1973,1972,1971,1970,1969,1968,1967
This statistics in other country:
AfghanistanAlbaniaAlgeriaAndorraAngolaAntigua and BarbudaArab WorldArgentinaArmeniaArubaAustraliaAustriaAzerbaijanBahamas, TheBahrainBangladeshBarbadosBelarusBelgiumBelizeBeninBermudaBhutanBoliviaBosnia and HerzegovinaBotswanaBrazilBrunei DarussalamBulgariaBurkina FasoBurundiCabo VerdeCambodiaCameroonCanadaCaribbean small statesCayman IslandsCentral African RepublicCentral Europe and the BalticsChadChileChinaColombiaComorosCongo, Dem. Rep.Congo, Rep.Costa RicaCote d'IvoireCroatiaCubaCyprusCzech RepublicDenmarkDjiboutiDominicaDominican RepublicEarly-demographic dividendEast Asia & PacificEast Asia & Pacific (excluding high income)East Asia & Pacific (IDA & IBRD countries)EcuadorEgypt, Arab Rep.El SalvadorEquatorial GuineaEritreaEstoniaEthiopiaEuro areaEurope & Central AsiaEurope & Central Asia (excluding high income)Europe & Central Asia (IDA & IBRD countries)European UnionFaroe IslandsFijiFinlandFragile and conflict affected situationsFranceFrench PolynesiaGabonGambia, TheGeorgiaGermanyGhanaGreeceGreenlandGrenadaGuatemalaGuineaGuinea-BissauGuyanaHaitiHeavily indebted poor countries (HIPC)High incomeHondurasHong Kong SAR, ChinaHungaryIBRD onlyIcelandIDA & IBRD totalIDA blendIDA onlyIDA totalIndiaIndonesiaIran, Islamic Rep.IraqIrelandIsraelItalyJamaicaJapanJordanKazakhstanKenyaKiribatiKorea, Rep.KuwaitKyrgyz RepublicLao PDRLate-demographic dividendLatin America & Caribbean Latin America & Caribbean (excluding high income)Latin America & the Caribbean (IDA & IBRD countries)LatviaLeast developed countries: UN classificationLebanonLesothoLiberiaLibyaLithuaniaLow & middle incomeLower middle incomeLuxembourgMacao SAR, ChinaMacedonia, FYRMadagascarMalawiMalaysiaMaldivesMaliMaltaMauritaniaMauritiusMexicoMiddle East & North AfricaMiddle East & North Africa (excluding high income)Middle East & North Africa (IDA & IBRD countries)Middle incomeMoldovaMongoliaMoroccoMozambiqueMyanmarNamibiaNepalNetherlandsNew CaledoniaNew ZealandNicaraguaNigerNigeriaNorth AmericaNorwayOECD membersOmanOther small statesPacific island small statesPakistanPalauPanamaPapua New GuineaParaguayPeruPhilippinesPolandPortugalPost-demographic dividendPre-demographic dividendQatarRomaniaRussian FederationRwandaSamoaSao Tome and PrincipeSaudi ArabiaSenegalSerbiaSeychellesSierra LeoneSingaporeSlovak RepublicSloveniaSmall statesSolomon IslandsSomaliaSouth AfricaSouth AsiaSouth Asia (IDA & IBRD)SpainSri LankaSt. Kitts and NevisSt. LuciaSt. Vincent and the GrenadinesSub-Saharan Africa Sub-Saharan Africa (excluding high income)Sub-Saharan Africa (IDA & IBRD countries)SudanSurinameSwazilandSwedenSwitzerlandSyrian Arab RepublicTajikistanTanzaniaThailandTimor-LesteTogoTongaTrinidad and TobagoTunisiaTurkeyTurkmenistanTurks and Caicos IslandsTuvaluUgandaUkraineUnited Arab EmiratesUnited KingdomUnited StatesUpper middle incomeUruguayVanuatuVenezuela, RBVietnamVirgin Islands (U.S.)WorldYemen, Rep.ZambiaZimbabwe Timeline:
This timeline shows a graph from 1967 to 2016 of Hungary. No data until 1966. Number of actual observations by date: 49.
Source name:
World Development Indicators
Source organization:
World Bank staff estimates from the Comtrade database maintained by the United Nations Statistics Division.
Categories, topics:
Energy & Mining, Private Sector, Trade
Last updated:
apr 23, 2017
Indicators value changes by year
At the date of observation
Value
Absolute change
Change from previous value
jan 1, 1967
0.066
+0.066
0.0%
jan 1, 1968
0.019
-0.046
-70.57%
jan 1, 1969
0.003
-0.017
-86.33%
jan 1, 1970
0.001
-0.002
-60.16%
jan 1, 1971
0.003
+0.002
164.11%
jan 1, 1972
0.003
+0.001
19.59%
jan 1, 1973
0.008
+0.005
136.94%
jan 1, 1974
0.014
+0.006
78.33%
jan 1, 1975
0.02
+0.006
41.77%
jan 1, 1976
0.031
+0.012
58.34%
jan 1, 1977
2.969
+2.938
9.33K%
jan 1, 1978
3.071
+0.102
3.45%
jan 1, 1979
3.452
+0.38
12.38%
jan 1, 1980
4.198
+0.746
21.61%
jan 1, 1981
4.841
+0.643
15.31%
jan 1, 1982
4.741
-0.1
-2.06%
jan 1, 1983
6.604
+1.863
39.29%
jan 1, 1984
9.243
+2.639
39.96%
jan 1, 1985
8.632
-0.611
-6.61%
jan 1, 1986
5.109
-3.523
-40.81%
jan 1, 1987
4.014
-1.095
-21.43%
jan 1, 1988
4.197
+0.183
4.56%
jan 1, 1989
2.999
-1.198
-28.55%
jan 1, 1990
2.868
-0.131
-4.38%
jan 1, 1991
3.09
+0.222
7.75%
jan 1, 1993
3.206
+0.116
3.76%
jan 1, 1994
3.686
+0.48
14.96%
jan 1, 1995
3.438
-0.248
-6.72%
jan 1, 1996
3.047
-0.391
-11.36%
jan 1, 1997
3.383
+0.335
11.0%
jan 1, 1998
2.268
-1.114
-32.94%
jan 1, 1999
1.852
-0.417
-18.36%
jan 1, 2000
1.595
-0.257
-13.88%
jan 1, 2001
1.606
+0.011
0.7%
jan 1, 2002
1.564
-0.042
-2.61%
jan 1, 2003
1.477
-0.087
-5.55%
jan 1, 2004
1.56
+0.082
5.58%
jan 1, 2005
1.817
+0.257
16.49%
jan 1, 2006
2.6
+0.783
43.11%
jan 1, 2007
2.355
-0.245
-9.43%
jan 1, 2008
2.8
+0.445
18.89%
jan 1, 2009
3.098
+0.299
10.66%
jan 1, 2010
2.474
-0.624
-20.15%
jan 1, 2011
2.646
+0.172
6.94%
jan 1, 2012
3.469
+0.823
31.11%
jan 1, 2013
3.903
+0.434
12.52%
jan 1, 2014
3.587
-0.317
-8.11%
jan 1, 2015
3.342
-0.244
-6.82%
jan 1, 2016
2.312
-1.03
-30.82%
Ranking of countries by current statistics by years


Comments: