29
/
en
AIzaSyAYiBZKx7MnpbEhh9jyipgxe19OcubqV5w
April 1, 2024
264590
Togo
TGO
true
2
1
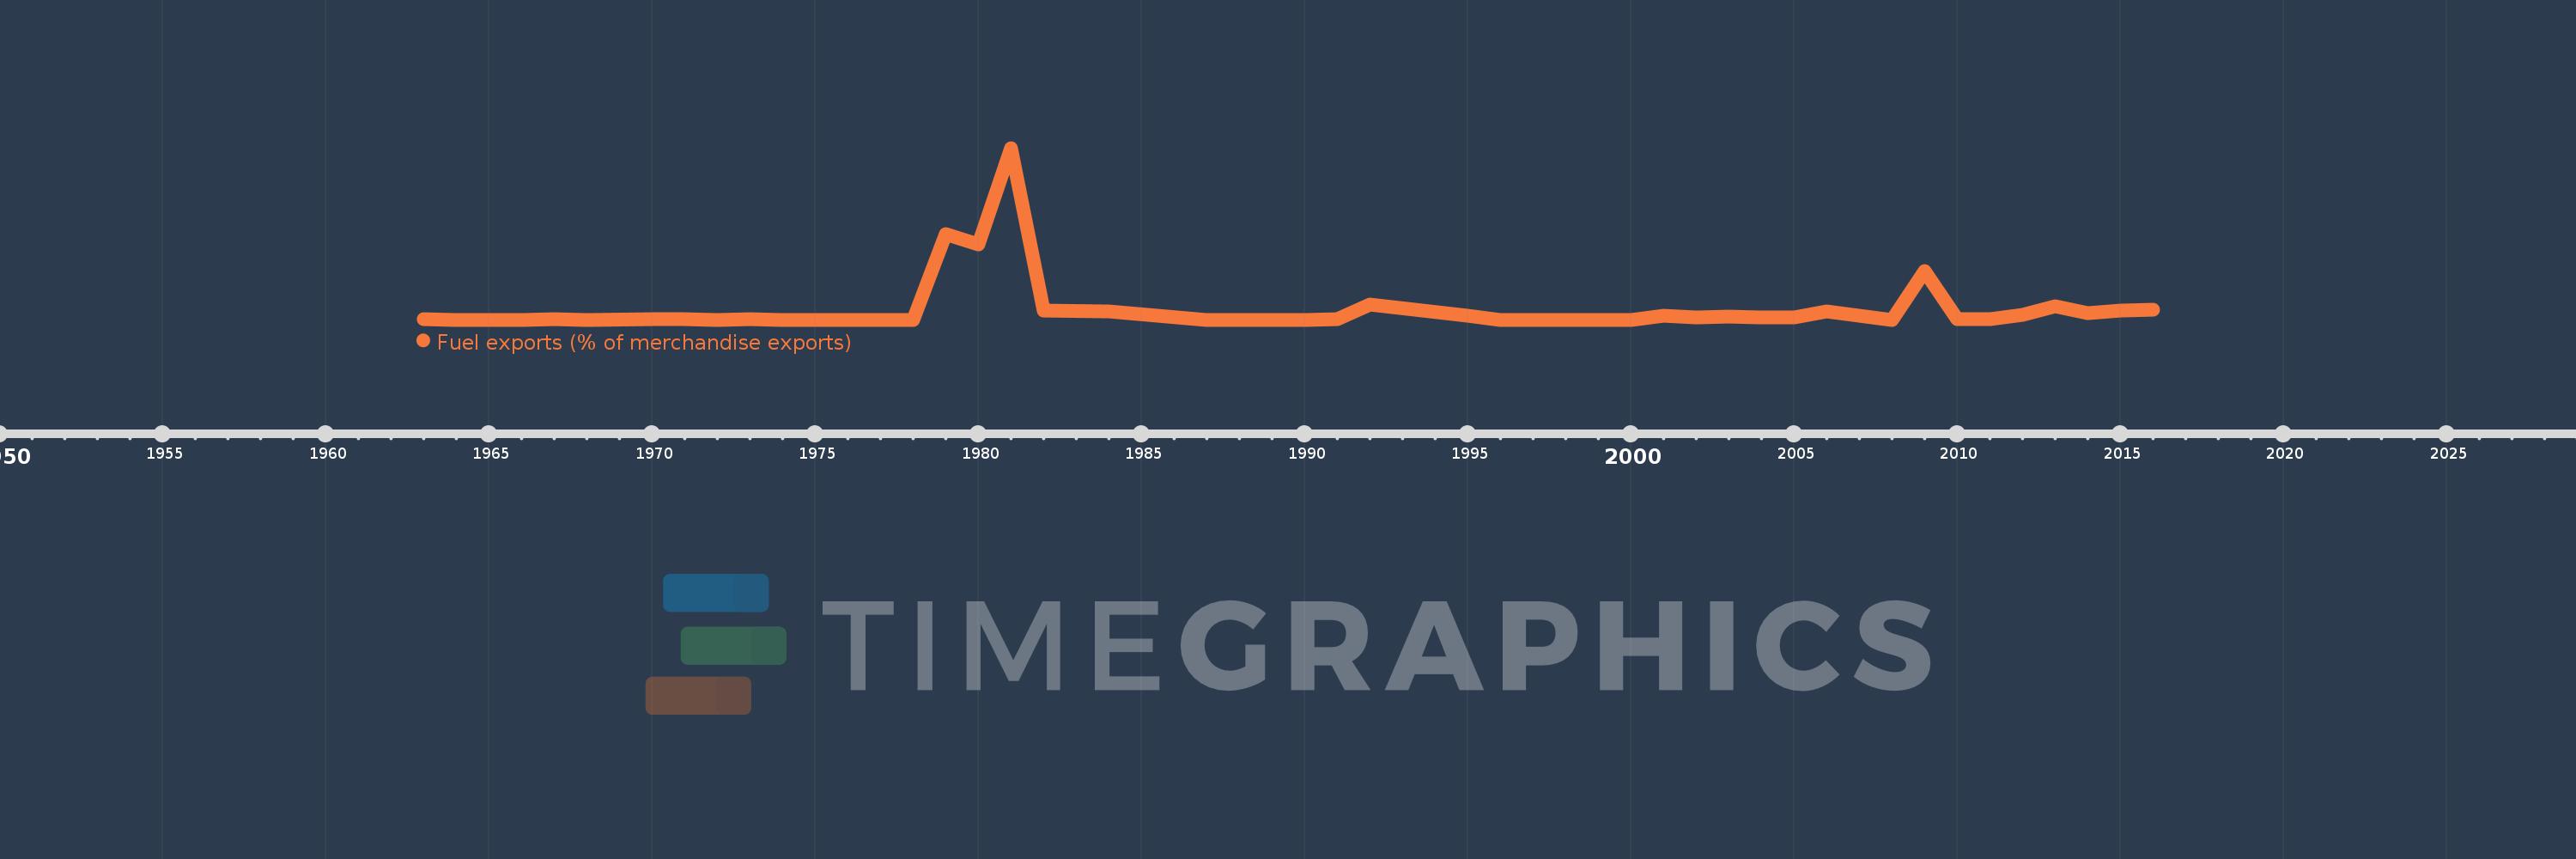
Fuel exports (% of merchandise exports)
2016,2015,2014,2013,2012,2011,2010,2009,2008,2006,2005,2004,2003,2002,2001,2000,1999,1998,1997,1996,1995,1992,1991,1990,1989,1988,1987,1984,1982,1981,1980,1979,1978,1977,1976,1975,1974,1973,1972,1971,1970,1968,1967,1966,1965,1964,1963
This statistics in other country:
AfghanistanAlbaniaAlgeriaAndorraAngolaAntigua and BarbudaArab WorldArgentinaArmeniaArubaAustraliaAustriaAzerbaijanBahamas, TheBahrainBangladeshBarbadosBelarusBelgiumBelizeBeninBermudaBhutanBoliviaBosnia and HerzegovinaBotswanaBrazilBrunei DarussalamBulgariaBurkina FasoBurundiCabo VerdeCambodiaCameroonCanadaCaribbean small statesCayman IslandsCentral African RepublicCentral Europe and the BalticsChadChileChinaColombiaComorosCongo, Dem. Rep.Congo, Rep.Costa RicaCote d'IvoireCroatiaCubaCyprusCzech RepublicDenmarkDjiboutiDominicaDominican RepublicEarly-demographic dividendEast Asia & PacificEast Asia & Pacific (excluding high income)East Asia & Pacific (IDA & IBRD countries)EcuadorEgypt, Arab Rep.El SalvadorEquatorial GuineaEritreaEstoniaEthiopiaEuro areaEurope & Central AsiaEurope & Central Asia (excluding high income)Europe & Central Asia (IDA & IBRD countries)European UnionFaroe IslandsFijiFinlandFragile and conflict affected situationsFranceFrench PolynesiaGabonGambia, TheGeorgiaGermanyGhanaGreeceGreenlandGrenadaGuatemalaGuineaGuinea-BissauGuyanaHaitiHeavily indebted poor countries (HIPC)High incomeHondurasHong Kong SAR, ChinaHungaryIBRD onlyIcelandIDA & IBRD totalIDA blendIDA onlyIDA totalIndiaIndonesiaIran, Islamic Rep.IraqIrelandIsraelItalyJamaicaJapanJordanKazakhstanKenyaKiribatiKorea, Rep.KuwaitKyrgyz RepublicLao PDRLate-demographic dividendLatin America & Caribbean Latin America & Caribbean (excluding high income)Latin America & the Caribbean (IDA & IBRD countries)LatviaLeast developed countries: UN classificationLebanonLesothoLiberiaLibyaLithuaniaLow & middle incomeLower middle incomeLuxembourgMacao SAR, ChinaMacedonia, FYRMadagascarMalawiMalaysiaMaldivesMaliMaltaMauritaniaMauritiusMexicoMiddle East & North AfricaMiddle East & North Africa (excluding high income)Middle East & North Africa (IDA & IBRD countries)Middle incomeMoldovaMongoliaMoroccoMozambiqueMyanmarNamibiaNepalNetherlandsNew CaledoniaNew ZealandNicaraguaNigerNigeriaNorth AmericaNorwayOECD membersOmanOther small statesPacific island small statesPakistanPalauPanamaPapua New GuineaParaguayPeruPhilippinesPolandPortugalPost-demographic dividendPre-demographic dividendQatarRomaniaRussian FederationRwandaSamoaSao Tome and PrincipeSaudi ArabiaSenegalSerbiaSeychellesSierra LeoneSingaporeSlovak RepublicSloveniaSmall statesSolomon IslandsSomaliaSouth AfricaSouth AsiaSouth Asia (IDA & IBRD)SpainSri LankaSt. Kitts and NevisSt. LuciaSt. Vincent and the GrenadinesSub-Saharan Africa Sub-Saharan Africa (excluding high income)Sub-Saharan Africa (IDA & IBRD countries)SudanSurinameSwazilandSwedenSwitzerlandSyrian Arab RepublicTajikistanTanzaniaThailandTimor-LesteTogoTongaTrinidad and TobagoTunisiaTurkeyTurkmenistanTurks and Caicos IslandsTuvaluUgandaUkraineUnited Arab EmiratesUnited KingdomUnited StatesUpper middle incomeUruguayVanuatuVenezuela, RBVietnamVirgin Islands (U.S.)WorldYemen, Rep.ZambiaZimbabwe Timeline:
This timeline shows a graph from 1963 to 2016 of Togo. No data until 1962. Number of actual observations by date: 47.
Source name:
World Development Indicators
Source organization:
World Bank staff estimates from the Comtrade database maintained by the United Nations Statistics Division.
Categories, topics:
Energy & Mining, Private Sector, Trade
Last updated:
apr 23, 2017
Indicators value changes by year
Maximum:
25.944
jan 1, 1981
At the date of observation
Value
Absolute change
Change from previous value
jan 1, 1963
0.053
+0.053
0.0%
jan 1, 1964
0.011
-0.041
-78.45%
jan 1, 1965
0.019
+0.008
66.52%
jan 1, 1966
0.016
-0.002
-13.09%
jan 1, 1967
0.037
+0.021
124.91%
jan 1, 1968
0.016
-0.021
-56.87%
jan 1, 1970
0.079
+0.063
394.7%
jan 1, 1971
0.042
-0.036
-46.25%
jan 1, 1972
0.008
-0.035
-82.18%
jan 1, 1973
0.046
+0.038
504.0%
jan 1, 1974
0.004
-0.041
-90.54%
jan 1, 1975
0.004
+0.0
1.95%
jan 1, 1976
0.022
+0.018
401.19%
jan 1, 1977
0.003
-0.019
-85.87%
jan 1, 1978
0.025
+0.022
714.72%
jan 1, 1979
12.977
+12.952
51.06K%
jan 1, 1980
11.335
-1.642
-12.66%
jan 1, 1981
25.944
+14.609
128.88%
jan 1, 1982
1.324
-24.62
-94.9%
jan 1, 1984
1.266
-0.058
-4.39%
jan 1, 1987
0.011
-1.254
-99.11%
jan 1, 1988
0.01
-0.001
-7.83%
jan 1, 1989
0.008
-0.002
-23.14%
jan 1, 1990
0.002
-0.006
-75.94%
jan 1, 1991
0.026
+0.024
1.26K%
jan 1, 1992
2.347
+2.32
8.89K%
jan 1, 1995
0.578
-1.768
-75.35%
jan 1, 1996
0.0
-0.578
-99.96%
jan 1, 1997
0.019
+0.019
8.99K%
jan 1, 1998
0.003
-0.016
-86.09%
jan 1, 1999
0.004
+0.001
56.29%
jan 1, 2000
0.0
-0.004
-100.0%
jan 1, 2001
0.647
+0.647
%
jan 1, 2002
0.409
-0.238
-36.72%
jan 1, 2003
0.534
+0.125
30.58%
jan 1, 2004
0.346
-0.188
-35.2%
jan 1, 2005
0.369
+0.023
6.61%
jan 1, 2006
1.249
+0.879
238.23%
jan 1, 2008
0.005
-1.244
-99.6%
jan 1, 2009
7.394
+7.39
149.23K%
jan 1, 2010
0.036
-7.358
-99.51%
jan 1, 2011
0.1
+0.064
176.29%
jan 1, 2012
0.718
+0.618
620.36%
jan 1, 2013
2.017
+1.3
181.13%
jan 1, 2014
0.995
-1.022
-50.68%
jan 1, 2015
1.393
+0.398
40.01%
jan 1, 2016
1.534
+0.141
10.14%
Ranking of countries by current statistics by years


Comments: