29
/
en
AIzaSyAYiBZKx7MnpbEhh9jyipgxe19OcubqV5w
April 1, 2024
157273
Iran, Islamic Rep.
IRN
true
2
1
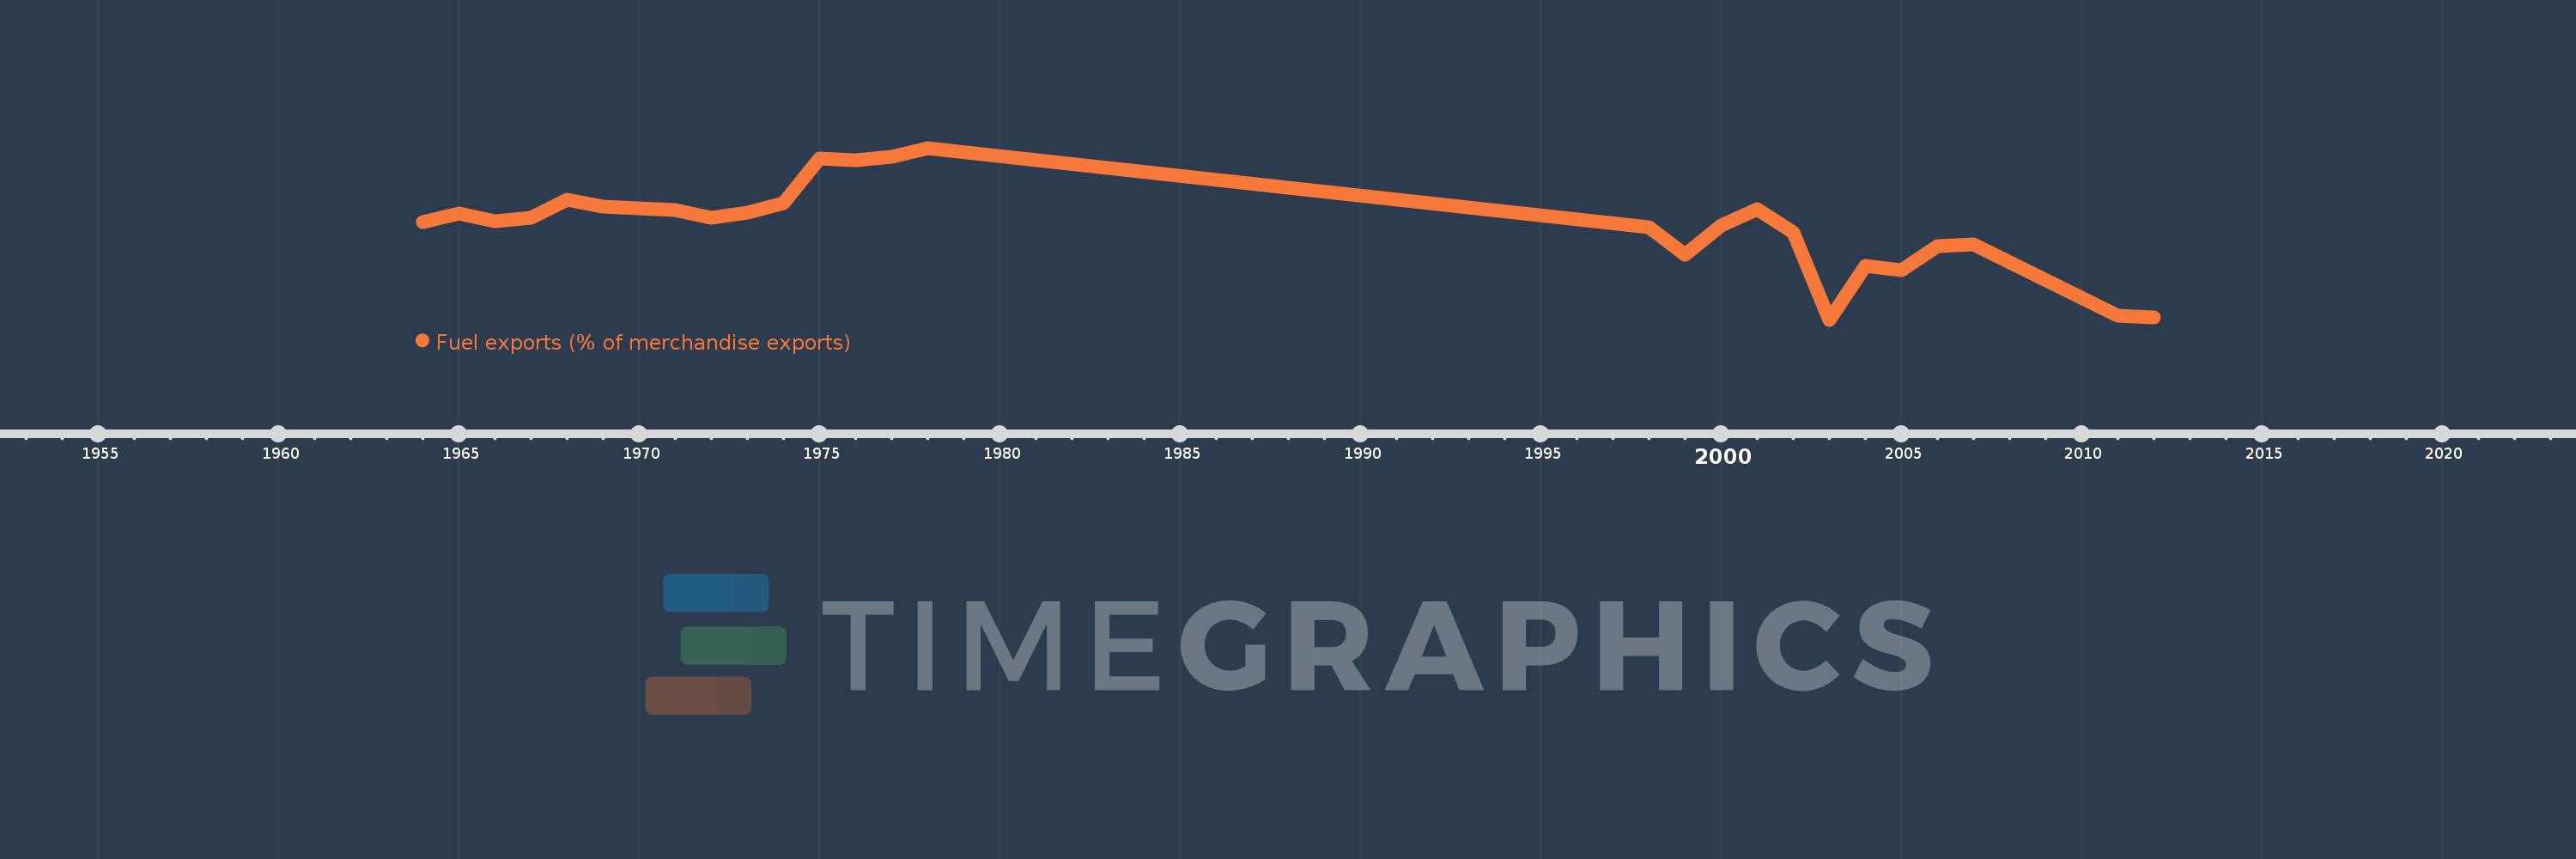
Fuel exports (% of merchandise exports)
2012,2011,2007,2006,2005,2004,2003,2002,2001,2000,1999,1998,1978,1977,1976,1975,1974,1973,1972,1971,1970,1969,1968,1967,1966,1965,1964
This statistics in other country:
AfghanistanAlbaniaAlgeriaAndorraAngolaAntigua and BarbudaArab WorldArgentinaArmeniaArubaAustraliaAustriaAzerbaijanBahamas, TheBahrainBangladeshBarbadosBelarusBelgiumBelizeBeninBermudaBhutanBoliviaBosnia and HerzegovinaBotswanaBrazilBrunei DarussalamBulgariaBurkina FasoBurundiCabo VerdeCambodiaCameroonCanadaCaribbean small statesCayman IslandsCentral African RepublicCentral Europe and the BalticsChadChileChinaColombiaComorosCongo, Dem. Rep.Congo, Rep.Costa RicaCote d'IvoireCroatiaCubaCyprusCzech RepublicDenmarkDjiboutiDominicaDominican RepublicEarly-demographic dividendEast Asia & PacificEast Asia & Pacific (excluding high income)East Asia & Pacific (IDA & IBRD countries)EcuadorEgypt, Arab Rep.El SalvadorEquatorial GuineaEritreaEstoniaEthiopiaEuro areaEurope & Central AsiaEurope & Central Asia (excluding high income)Europe & Central Asia (IDA & IBRD countries)European UnionFaroe IslandsFijiFinlandFragile and conflict affected situationsFranceFrench PolynesiaGabonGambia, TheGeorgiaGermanyGhanaGreeceGreenlandGrenadaGuatemalaGuineaGuinea-BissauGuyanaHaitiHeavily indebted poor countries (HIPC)High incomeHondurasHong Kong SAR, ChinaHungaryIBRD onlyIcelandIDA & IBRD totalIDA blendIDA onlyIDA totalIndiaIndonesiaIran, Islamic Rep.IraqIrelandIsraelItalyJamaicaJapanJordanKazakhstanKenyaKiribatiKorea, Rep.KuwaitKyrgyz RepublicLao PDRLate-demographic dividendLatin America & Caribbean Latin America & Caribbean (excluding high income)Latin America & the Caribbean (IDA & IBRD countries)LatviaLeast developed countries: UN classificationLebanonLesothoLiberiaLibyaLithuaniaLow & middle incomeLower middle incomeLuxembourgMacao SAR, ChinaMacedonia, FYRMadagascarMalawiMalaysiaMaldivesMaliMaltaMauritaniaMauritiusMexicoMiddle East & North AfricaMiddle East & North Africa (excluding high income)Middle East & North Africa (IDA & IBRD countries)Middle incomeMoldovaMongoliaMoroccoMozambiqueMyanmarNamibiaNepalNetherlandsNew CaledoniaNew ZealandNicaraguaNigerNigeriaNorth AmericaNorwayOECD membersOmanOther small statesPacific island small statesPakistanPalauPanamaPapua New GuineaParaguayPeruPhilippinesPolandPortugalPost-demographic dividendPre-demographic dividendQatarRomaniaRussian FederationRwandaSamoaSao Tome and PrincipeSaudi ArabiaSenegalSerbiaSeychellesSierra LeoneSingaporeSlovak RepublicSloveniaSmall statesSolomon IslandsSomaliaSouth AfricaSouth AsiaSouth Asia (IDA & IBRD)SpainSri LankaSt. Kitts and NevisSt. LuciaSt. Vincent and the GrenadinesSub-Saharan Africa Sub-Saharan Africa (excluding high income)Sub-Saharan Africa (IDA & IBRD countries)SudanSurinameSwazilandSwedenSwitzerlandSyrian Arab RepublicTajikistanTanzaniaThailandTimor-LesteTogoTongaTrinidad and TobagoTunisiaTurkeyTurkmenistanTurks and Caicos IslandsTuvaluUgandaUkraineUnited Arab EmiratesUnited KingdomUnited StatesUpper middle incomeUruguayVanuatuVenezuela, RBVietnamVirgin Islands (U.S.)WorldYemen, Rep.ZambiaZimbabwe Timeline:
This timeline shows a graph from 1964 to 2012 of Iran, Islamic Rep.. No data until 1963. Number of actual observations by date: 27.
Source name:
World Development Indicators
Source organization:
World Bank staff estimates from the Comtrade database maintained by the United Nations Statistics Division.
Categories, topics:
Energy & Mining, Private Sector, Trade
Last updated:
apr 23, 2017
Indicators value changes by year
Minimum:
70.091
jan 1, 2003
Maximum:
99.151
jan 1, 1978
At the date of observation
Value
Absolute change
Change from previous value
jan 1, 1964
86.587
+86.587
0.0%
jan 1, 1965
87.999
+1.412
1.63%
jan 1, 1966
86.724
-1.275
-1.45%
jan 1, 1967
87.271
+0.547
0.63%
jan 1, 1968
90.373
+3.102
3.55%
jan 1, 1969
89.254
-1.118
-1.24%
jan 1, 1970
88.896
-0.358
-0.4%
jan 1, 1971
88.618
-0.278
-0.31%
jan 1, 1972
87.312
-1.306
-1.47%
jan 1, 1973
88.255
+0.943
1.08%
jan 1, 1974
89.769
+1.514
1.72%
jan 1, 1975
97.332
+7.562
8.42%
jan 1, 1976
97.043
-0.289
-0.3%
jan 1, 1977
97.614
+0.572
0.59%
jan 1, 1978
99.151
+1.537
1.57%
jan 1, 1998
85.749
-13.402
-13.52%
jan 1, 1999
81.082
-4.667
-5.44%
jan 1, 2000
86.035
+4.953
6.11%
jan 1, 2001
88.742
+2.707
3.15%
jan 1, 2002
84.877
-3.865
-4.35%
jan 1, 2003
70.091
-14.787
-17.42%
jan 1, 2004
79.133
+9.043
12.9%
jan 1, 2005
78.547
-0.587
-0.74%
jan 1, 2006
82.611
+4.064
5.17%
jan 1, 2007
82.794
+0.182
0.22%
jan 1, 2011
70.775
-12.019
-14.52%
jan 1, 2012
70.479
-0.296
-0.42%
Ranking of countries by current statistics by years


Comments: