29
/
en
AIzaSyAYiBZKx7MnpbEhh9jyipgxe19OcubqV5w
April 1, 2024
142534
Greenland
GRL
true
2
1
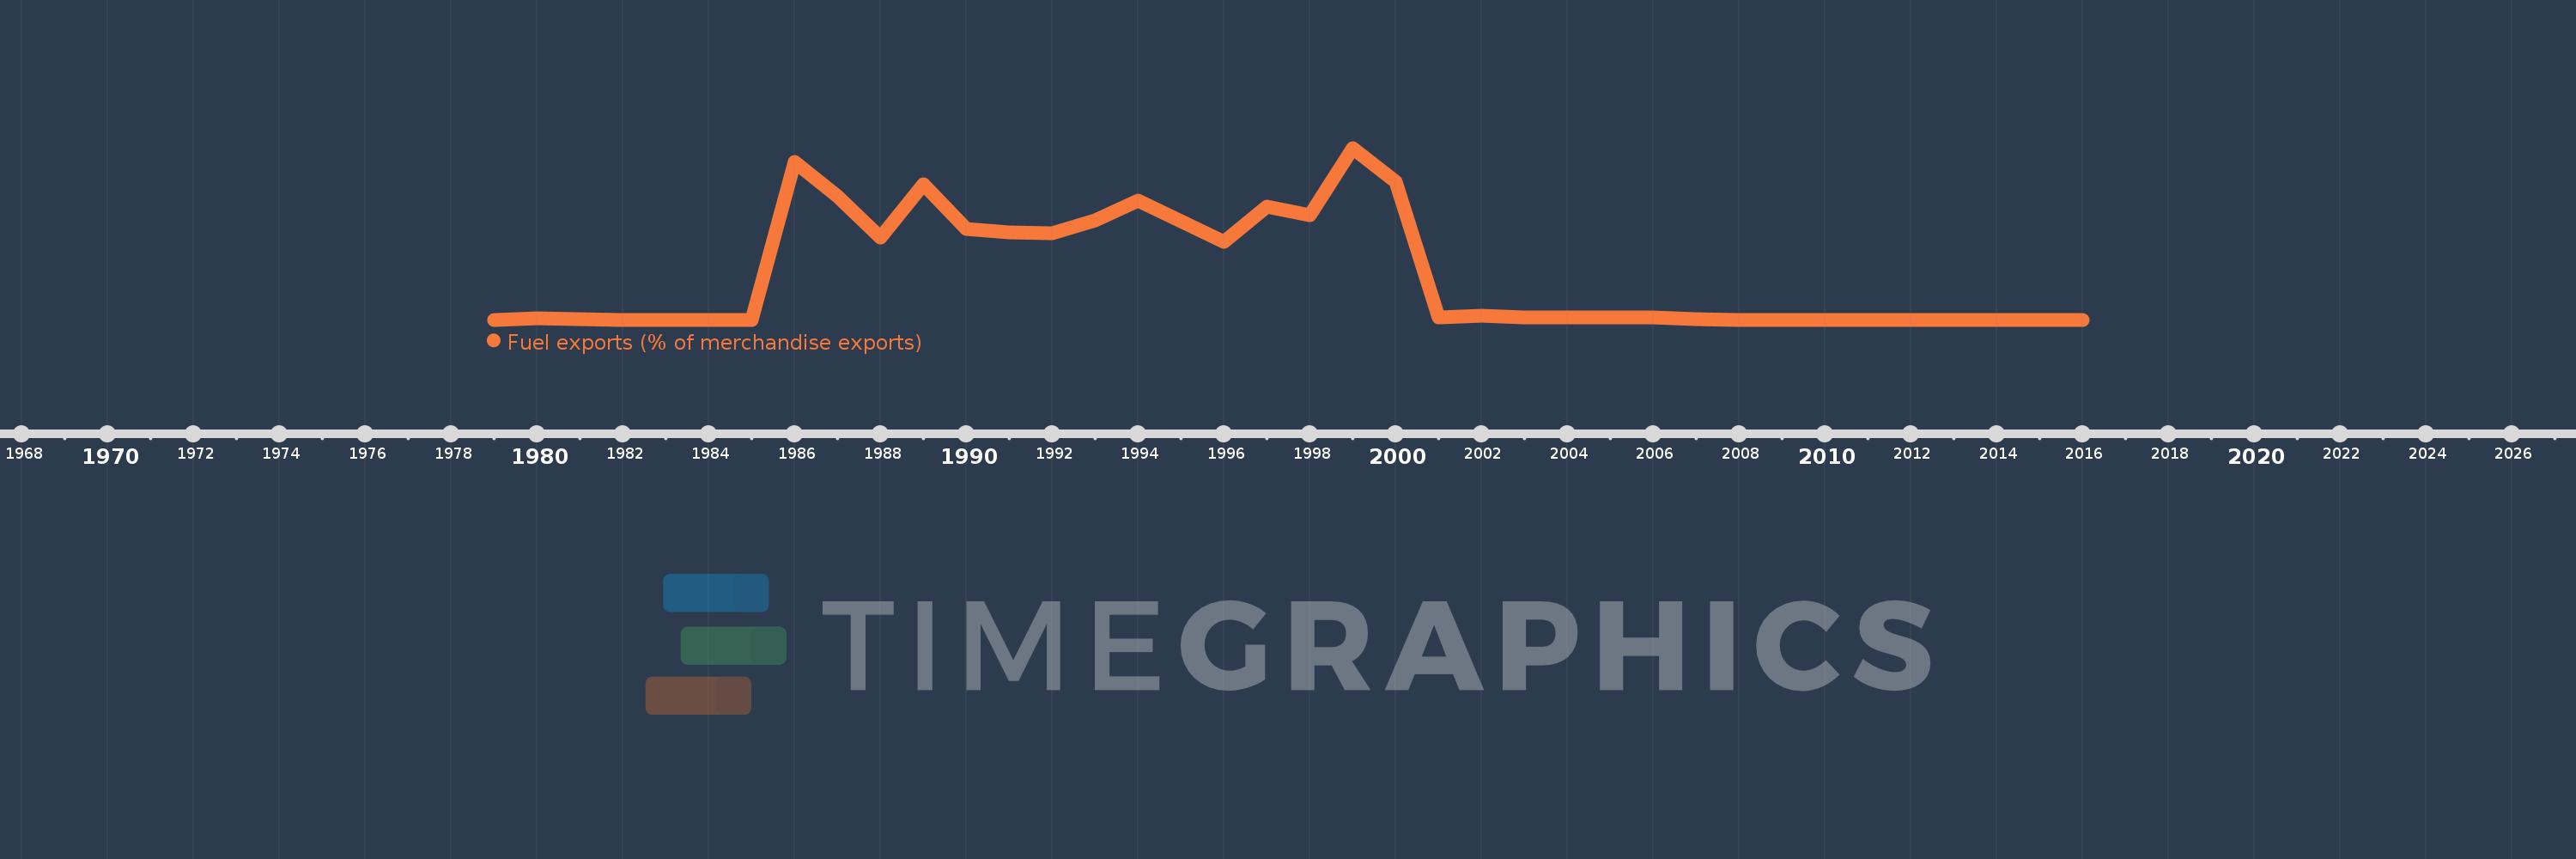
Fuel exports (% of merchandise exports)
2016,2015,2014,2013,2012,2011,2010,2009,2008,2007,2006,2005,2004,2003,2002,2001,2000,1999,1998,1997,1996,1994,1993,1992,1991,1990,1989,1988,1987,1986,1985,1984,1983,1982,1980,1979
This statistics in other country:
AfghanistanAlbaniaAlgeriaAndorraAngolaAntigua and BarbudaArab WorldArgentinaArmeniaArubaAustraliaAustriaAzerbaijanBahamas, TheBahrainBangladeshBarbadosBelarusBelgiumBelizeBeninBermudaBhutanBoliviaBosnia and HerzegovinaBotswanaBrazilBrunei DarussalamBulgariaBurkina FasoBurundiCabo VerdeCambodiaCameroonCanadaCaribbean small statesCayman IslandsCentral African RepublicCentral Europe and the BalticsChadChileChinaColombiaComorosCongo, Dem. Rep.Congo, Rep.Costa RicaCote d'IvoireCroatiaCubaCyprusCzech RepublicDenmarkDjiboutiDominicaDominican RepublicEarly-demographic dividendEast Asia & PacificEast Asia & Pacific (excluding high income)East Asia & Pacific (IDA & IBRD countries)EcuadorEgypt, Arab Rep.El SalvadorEquatorial GuineaEritreaEstoniaEthiopiaEuro areaEurope & Central AsiaEurope & Central Asia (excluding high income)Europe & Central Asia (IDA & IBRD countries)European UnionFaroe IslandsFijiFinlandFragile and conflict affected situationsFranceFrench PolynesiaGabonGambia, TheGeorgiaGermanyGhanaGreeceGreenlandGrenadaGuatemalaGuineaGuinea-BissauGuyanaHaitiHeavily indebted poor countries (HIPC)High incomeHondurasHong Kong SAR, ChinaHungaryIBRD onlyIcelandIDA & IBRD totalIDA blendIDA onlyIDA totalIndiaIndonesiaIran, Islamic Rep.IraqIrelandIsraelItalyJamaicaJapanJordanKazakhstanKenyaKiribatiKorea, Rep.KuwaitKyrgyz RepublicLao PDRLate-demographic dividendLatin America & Caribbean Latin America & Caribbean (excluding high income)Latin America & the Caribbean (IDA & IBRD countries)LatviaLeast developed countries: UN classificationLebanonLesothoLiberiaLibyaLithuaniaLow & middle incomeLower middle incomeLuxembourgMacao SAR, ChinaMacedonia, FYRMadagascarMalawiMalaysiaMaldivesMaliMaltaMauritaniaMauritiusMexicoMiddle East & North AfricaMiddle East & North Africa (excluding high income)Middle East & North Africa (IDA & IBRD countries)Middle incomeMoldovaMongoliaMoroccoMozambiqueMyanmarNamibiaNepalNetherlandsNew CaledoniaNew ZealandNicaraguaNigerNigeriaNorth AmericaNorwayOECD membersOmanOther small statesPacific island small statesPakistanPalauPanamaPapua New GuineaParaguayPeruPhilippinesPolandPortugalPost-demographic dividendPre-demographic dividendQatarRomaniaRussian FederationRwandaSamoaSao Tome and PrincipeSaudi ArabiaSenegalSerbiaSeychellesSierra LeoneSingaporeSlovak RepublicSloveniaSmall statesSolomon IslandsSomaliaSouth AfricaSouth AsiaSouth Asia (IDA & IBRD)SpainSri LankaSt. Kitts and NevisSt. LuciaSt. Vincent and the GrenadinesSub-Saharan Africa Sub-Saharan Africa (excluding high income)Sub-Saharan Africa (IDA & IBRD countries)SudanSurinameSwazilandSwedenSwitzerlandSyrian Arab RepublicTajikistanTanzaniaThailandTimor-LesteTogoTongaTrinidad and TobagoTunisiaTurkeyTurkmenistanTurks and Caicos IslandsTuvaluUgandaUkraineUnited Arab EmiratesUnited KingdomUnited StatesUpper middle incomeUruguayVanuatuVenezuela, RBVietnamVirgin Islands (U.S.)WorldYemen, Rep.ZambiaZimbabwe Timeline:
This timeline shows a graph from 1979 to 2016 of Greenland. No data until 1978. Number of actual observations by date: 36.
Source name:
World Development Indicators
Source organization:
World Bank staff estimates from the Comtrade database maintained by the United Nations Statistics Division.
Categories, topics:
Energy & Mining, Private Sector, Trade
Last updated:
apr 23, 2017
Indicators value changes by year
At the date of observation
Value
Absolute change
Change from previous value
jan 1, 1980
0.019
+0.019
73.34K%
jan 1, 1982
0.0
-0.019
-98.42%
jan 1, 1983
0.0
0.0
-97.88%
jan 1, 1984
0.0
+0.0
193.35%
jan 1, 1985
0.0
+0.0
2.15K%
jan 1, 1986
1.606
+1.605
377.89K%
jan 1, 1987
1.255
-0.351
-21.86%
jan 1, 1988
0.836
-0.418
-33.35%
jan 1, 1989
1.381
+0.545
65.13%
jan 1, 1990
0.929
-0.452
-32.7%
jan 1, 1991
0.894
-0.035
-3.75%
jan 1, 1992
0.88
-0.015
-1.64%
jan 1, 1993
1.013
+0.133
15.08%
jan 1, 1994
1.218
+0.205
20.25%
jan 1, 1996
0.793
-0.424
-34.84%
jan 1, 1997
1.149
+0.356
44.85%
jan 1, 1998
1.063
-0.086
-7.5%
jan 1, 1999
1.751
+0.688
64.69%
jan 1, 2000
1.407
-0.344
-19.62%
jan 1, 2001
0.027
-1.38
-98.08%
jan 1, 2002
0.038
+0.011
41.2%
jan 1, 2003
0.025
-0.013
-34.76%
jan 1, 2004
0.028
+0.003
12.89%
jan 1, 2005
0.023
-0.005
-19.49%
jan 1, 2006
0.022
-0.001
-2.27%
jan 1, 2007
0.008
-0.014
-65.13%
jan 1, 2008
0.0
-0.008
-99.78%
jan 1, 2009
0.0
+0.0
1.92K%
jan 1, 2010
0.0
0.0
-82.12%
jan 1, 2011
0.0
+0.0
676.2%
jan 1, 2012
0.0
0.0
-45.74%
jan 1, 2013
0.0
0.0
-50.96%
jan 1, 2014
0.0
0.0
-43.37%
jan 1, 2015
0.0
0.0
-47.79%
jan 1, 2016
0.0
+0.0
508.6%
Ranking of countries by current statistics by years


Comments: