29
/
en
AIzaSyAYiBZKx7MnpbEhh9jyipgxe19OcubqV5w
April 1, 2024
222173
Peru
PER
true
2
1
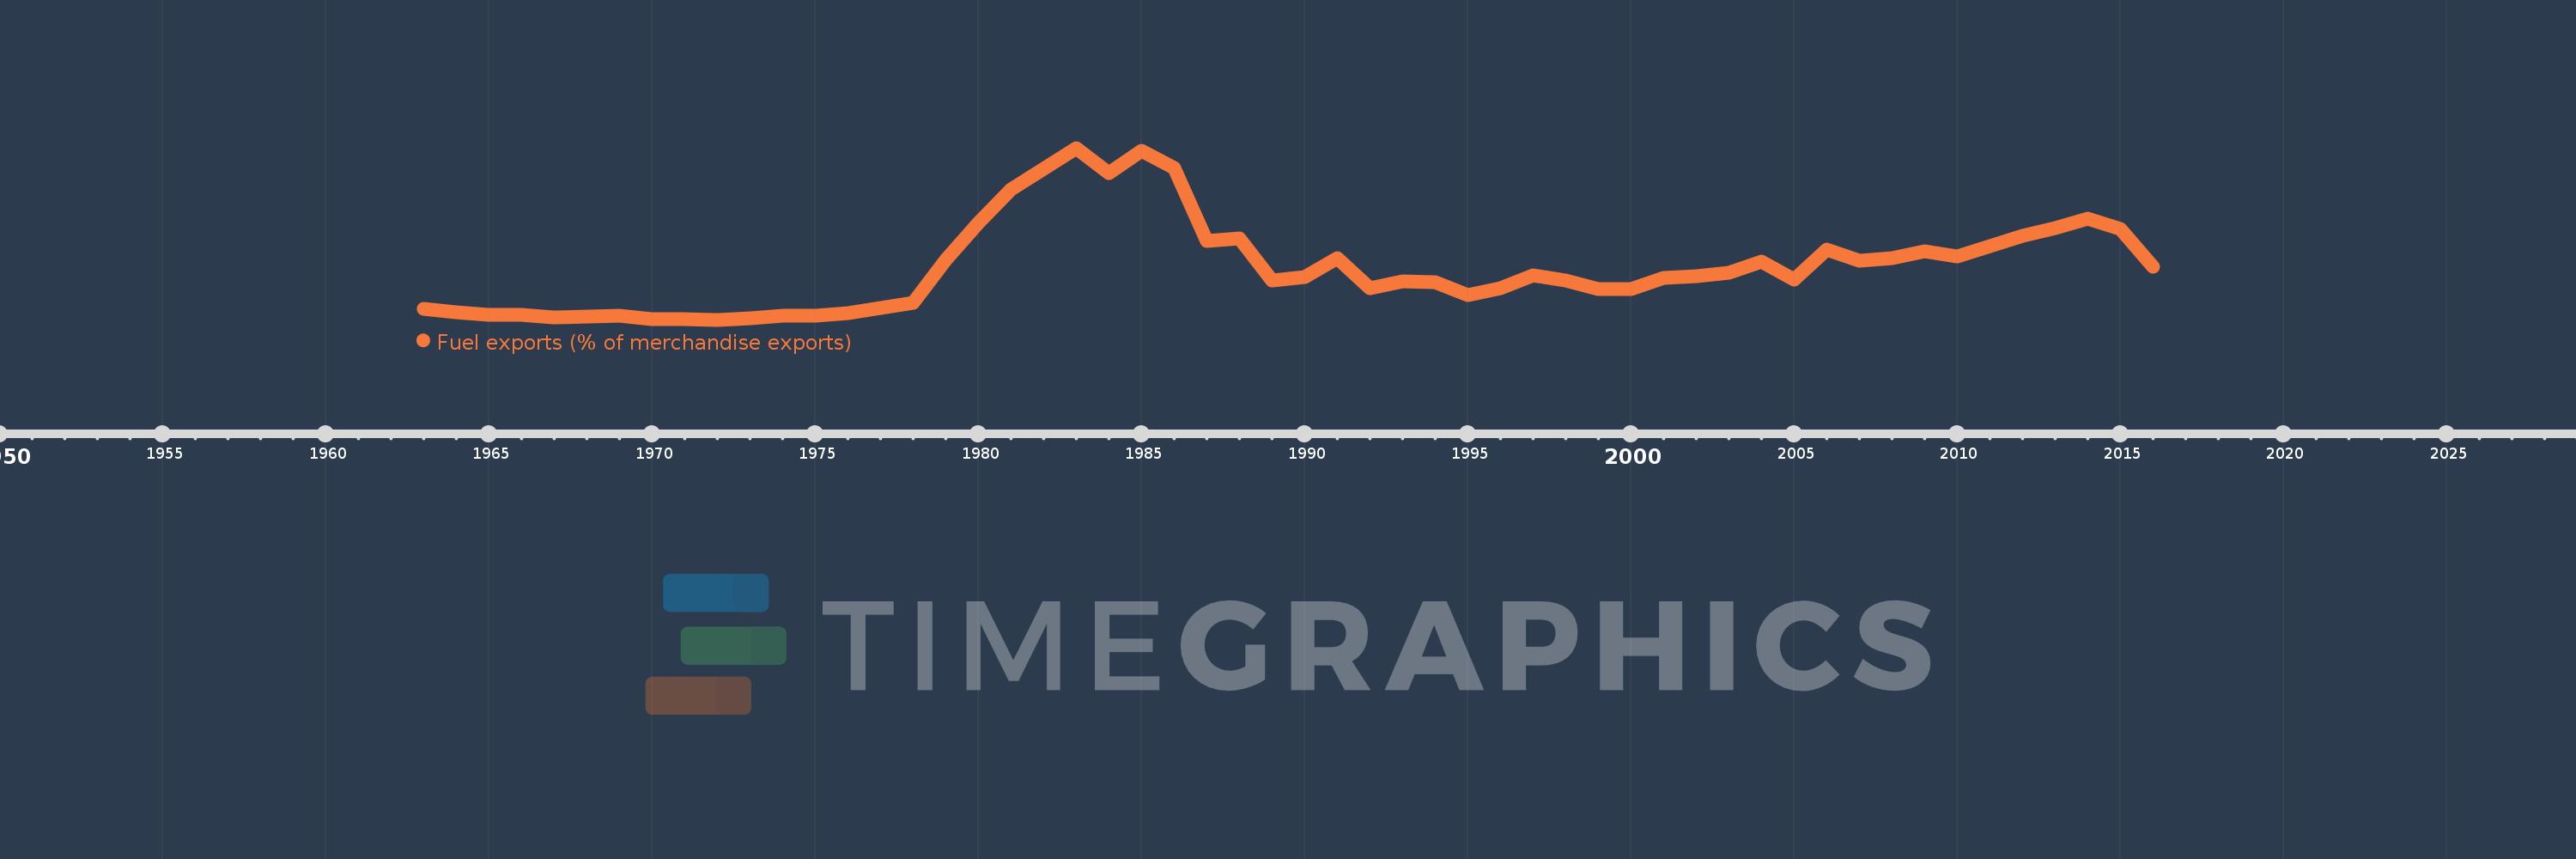
Fuel exports (% of merchandise exports)
2016,2015,2014,2013,2012,2011,2010,2009,2008,2007,2006,2005,2004,2003,2002,2001,2000,1999,1998,1997,1996,1995,1994,1993,1992,1991,1990,1989,1988,1987,1986,1985,1984,1983,1981,1980,1979,1978,1977,1976,1975,1974,1973,1972,1971,1970,1969,1968,1967,1966,1965,1964,1963
This statistics in other country:
AfghanistanAlbaniaAlgeriaAndorraAngolaAntigua and BarbudaArab WorldArgentinaArmeniaArubaAustraliaAustriaAzerbaijanBahamas, TheBahrainBangladeshBarbadosBelarusBelgiumBelizeBeninBermudaBhutanBoliviaBosnia and HerzegovinaBotswanaBrazilBrunei DarussalamBulgariaBurkina FasoBurundiCabo VerdeCambodiaCameroonCanadaCaribbean small statesCayman IslandsCentral African RepublicCentral Europe and the BalticsChadChileChinaColombiaComorosCongo, Dem. Rep.Congo, Rep.Costa RicaCote d'IvoireCroatiaCubaCyprusCzech RepublicDenmarkDjiboutiDominicaDominican RepublicEarly-demographic dividendEast Asia & PacificEast Asia & Pacific (excluding high income)East Asia & Pacific (IDA & IBRD countries)EcuadorEgypt, Arab Rep.El SalvadorEquatorial GuineaEritreaEstoniaEthiopiaEuro areaEurope & Central AsiaEurope & Central Asia (excluding high income)Europe & Central Asia (IDA & IBRD countries)European UnionFaroe IslandsFijiFinlandFragile and conflict affected situationsFranceFrench PolynesiaGabonGambia, TheGeorgiaGermanyGhanaGreeceGreenlandGrenadaGuatemalaGuineaGuinea-BissauGuyanaHaitiHeavily indebted poor countries (HIPC)High incomeHondurasHong Kong SAR, ChinaHungaryIBRD onlyIcelandIDA & IBRD totalIDA blendIDA onlyIDA totalIndiaIndonesiaIran, Islamic Rep.IraqIrelandIsraelItalyJamaicaJapanJordanKazakhstanKenyaKiribatiKorea, Rep.KuwaitKyrgyz RepublicLao PDRLate-demographic dividendLatin America & Caribbean Latin America & Caribbean (excluding high income)Latin America & the Caribbean (IDA & IBRD countries)LatviaLeast developed countries: UN classificationLebanonLesothoLiberiaLibyaLithuaniaLow & middle incomeLower middle incomeLuxembourgMacao SAR, ChinaMacedonia, FYRMadagascarMalawiMalaysiaMaldivesMaliMaltaMauritaniaMauritiusMexicoMiddle East & North AfricaMiddle East & North Africa (excluding high income)Middle East & North Africa (IDA & IBRD countries)Middle incomeMoldovaMongoliaMoroccoMozambiqueMyanmarNamibiaNepalNetherlandsNew CaledoniaNew ZealandNicaraguaNigerNigeriaNorth AmericaNorwayOECD membersOmanOther small statesPacific island small statesPakistanPalauPanamaPapua New GuineaParaguayPeruPhilippinesPolandPortugalPost-demographic dividendPre-demographic dividendQatarRomaniaRussian FederationRwandaSamoaSao Tome and PrincipeSaudi ArabiaSenegalSerbiaSeychellesSierra LeoneSingaporeSlovak RepublicSloveniaSmall statesSolomon IslandsSomaliaSouth AfricaSouth AsiaSouth Asia (IDA & IBRD)SpainSri LankaSt. Kitts and NevisSt. LuciaSt. Vincent and the GrenadinesSub-Saharan Africa Sub-Saharan Africa (excluding high income)Sub-Saharan Africa (IDA & IBRD countries)SudanSurinameSwazilandSwedenSwitzerlandSyrian Arab RepublicTajikistanTanzaniaThailandTimor-LesteTogoTongaTrinidad and TobagoTunisiaTurkeyTurkmenistanTurks and Caicos IslandsTuvaluUgandaUkraineUnited Arab EmiratesUnited KingdomUnited StatesUpper middle incomeUruguayVanuatuVenezuela, RBVietnamVirgin Islands (U.S.)WorldYemen, Rep.ZambiaZimbabwe Timeline:
This timeline shows a graph from 1963 to 2016 of Peru. No data until 1962. Number of actual observations by date: 53.
Source name:
World Development Indicators
Source organization:
World Bank staff estimates from the Comtrade database maintained by the United Nations Statistics Division.
Categories, topics:
Energy & Mining, Private Sector, Trade
Last updated:
apr 23, 2017
Indicators value changes by year
Maximum:
26.902
jan 1, 1983
At the date of observation
Value
Absolute change
Change from previous value
jan 1, 1963
2.35
+2.35
0.0%
jan 1, 1964
1.821
-0.529
-22.53%
jan 1, 1965
1.44
-0.381
-20.91%
jan 1, 1966
1.418
-0.022
-1.52%
jan 1, 1967
0.97
-0.448
-31.59%
jan 1, 1968
1.13
+0.16
16.45%
jan 1, 1969
1.284
+0.155
13.69%
jan 1, 1970
0.719
-0.565
-44.0%
jan 1, 1971
0.718
-0.001
-0.11%
jan 1, 1972
0.629
-0.09
-12.47%
jan 1, 1973
0.847
+0.218
34.74%
jan 1, 1974
1.226
+0.379
44.7%
jan 1, 1975
1.2
-0.026
-2.1%
jan 1, 1976
1.685
+0.485
40.42%
jan 1, 1977
2.403
+0.718
42.59%
jan 1, 1978
3.244
+0.841
35.02%
jan 1, 1979
9.842
+6.597
203.34%
jan 1, 1980
15.43
+5.588
56.78%
jan 1, 1981
20.606
+5.176
33.54%
jan 1, 1983
26.902
+6.297
30.56%
jan 1, 1984
23.09
-3.813
-14.17%
jan 1, 1985
26.483
+3.393
14.69%
jan 1, 1986
23.895
-2.587
-9.77%
jan 1, 1987
12.652
-11.244
-47.05%
jan 1, 1988
13.064
+0.413
3.26%
jan 1, 1989
6.674
-6.39
-48.91%
jan 1, 1990
7.097
+0.423
6.33%
jan 1, 1991
10.029
+2.933
41.33%
jan 1, 1992
5.513
-4.516
-45.03%
jan 1, 1993
6.472
+0.959
17.39%
jan 1, 1994
6.369
-0.103
-1.59%
jan 1, 1995
4.374
-1.994
-31.32%
jan 1, 1996
5.39
+1.016
23.23%
jan 1, 1997
7.364
+1.974
36.62%
jan 1, 1998
6.572
-0.792
-10.76%
jan 1, 1999
5.345
-1.227
-18.66%
jan 1, 2000
5.278
-0.068
-1.27%
jan 1, 2001
7.055
+1.778
33.68%
jan 1, 2002
7.316
+0.26
3.69%
jan 1, 2003
7.769
+0.453
6.2%
jan 1, 2004
9.588
+1.819
23.42%
jan 1, 2005
6.724
-2.864
-29.87%
jan 1, 2006
11.366
+4.641
69.02%
jan 1, 2007
9.624
-1.741
-15.32%
jan 1, 2008
10.082
+0.458
4.76%
jan 1, 2009
11.118
+1.036
10.27%
jan 1, 2010
10.349
-0.77
-6.92%
jan 1, 2011
11.915
+1.566
15.14%
jan 1, 2012
13.479
+1.564
13.13%
jan 1, 2013
14.663
+1.184
8.78%
jan 1, 2014
16.064
+1.401
9.56%
jan 1, 2015
14.476
-1.589
-9.89%
jan 1, 2016
8.741
-5.735
-39.62%
Ranking of countries by current statistics by years


Comments: