29
/
en
AIzaSyAYiBZKx7MnpbEhh9jyipgxe19OcubqV5w
April 1, 2024
69801
Argentina
ARG
true
2
1
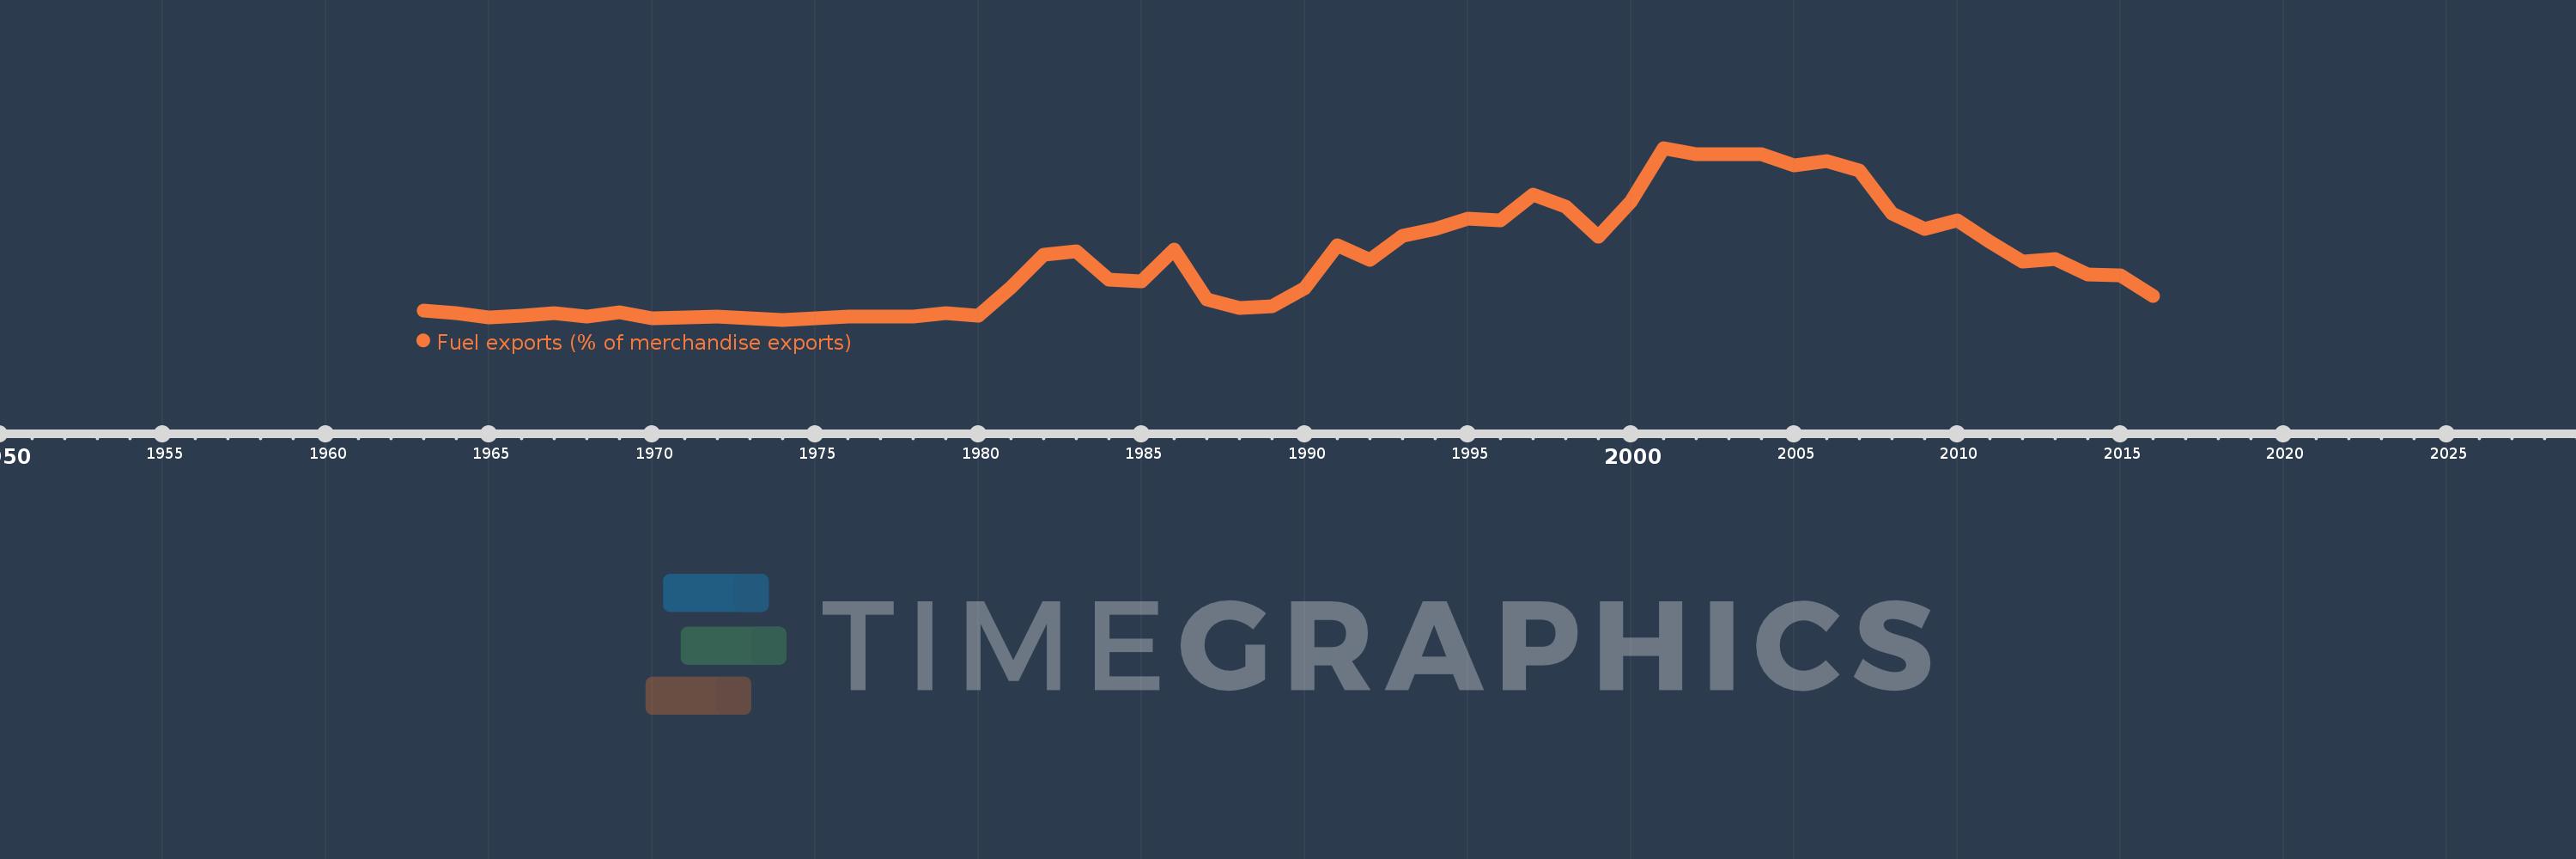
Fuel exports (% of merchandise exports)
2016,2015,2014,2013,2012,2011,2010,2009,2008,2007,2006,2005,2004,2003,2002,2001,2000,1999,1998,1997,1996,1995,1994,1993,1992,1991,1990,1989,1988,1987,1986,1985,1984,1983,1982,1981,1980,1979,1978,1977,1976,1975,1974,1973,1972,1971,1970,1969,1968,1967,1966,1965,1964,1963
This statistics in other country:
AfghanistanAlbaniaAlgeriaAndorraAngolaAntigua and BarbudaArab WorldArgentinaArmeniaArubaAustraliaAustriaAzerbaijanBahamas, TheBahrainBangladeshBarbadosBelarusBelgiumBelizeBeninBermudaBhutanBoliviaBosnia and HerzegovinaBotswanaBrazilBrunei DarussalamBulgariaBurkina FasoBurundiCabo VerdeCambodiaCameroonCanadaCaribbean small statesCayman IslandsCentral African RepublicCentral Europe and the BalticsChadChileChinaColombiaComorosCongo, Dem. Rep.Congo, Rep.Costa RicaCote d'IvoireCroatiaCubaCyprusCzech RepublicDenmarkDjiboutiDominicaDominican RepublicEarly-demographic dividendEast Asia & PacificEast Asia & Pacific (excluding high income)East Asia & Pacific (IDA & IBRD countries)EcuadorEgypt, Arab Rep.El SalvadorEquatorial GuineaEritreaEstoniaEthiopiaEuro areaEurope & Central AsiaEurope & Central Asia (excluding high income)Europe & Central Asia (IDA & IBRD countries)European UnionFaroe IslandsFijiFinlandFragile and conflict affected situationsFranceFrench PolynesiaGabonGambia, TheGeorgiaGermanyGhanaGreeceGreenlandGrenadaGuatemalaGuineaGuinea-BissauGuyanaHaitiHeavily indebted poor countries (HIPC)High incomeHondurasHong Kong SAR, ChinaHungaryIBRD onlyIcelandIDA & IBRD totalIDA blendIDA onlyIDA totalIndiaIndonesiaIran, Islamic Rep.IraqIrelandIsraelItalyJamaicaJapanJordanKazakhstanKenyaKiribatiKorea, Rep.KuwaitKyrgyz RepublicLao PDRLate-demographic dividendLatin America & Caribbean Latin America & Caribbean (excluding high income)Latin America & the Caribbean (IDA & IBRD countries)LatviaLeast developed countries: UN classificationLebanonLesothoLiberiaLibyaLithuaniaLow & middle incomeLower middle incomeLuxembourgMacao SAR, ChinaMacedonia, FYRMadagascarMalawiMalaysiaMaldivesMaliMaltaMauritaniaMauritiusMexicoMiddle East & North AfricaMiddle East & North Africa (excluding high income)Middle East & North Africa (IDA & IBRD countries)Middle incomeMoldovaMongoliaMoroccoMozambiqueMyanmarNamibiaNepalNetherlandsNew CaledoniaNew ZealandNicaraguaNigerNigeriaNorth AmericaNorwayOECD membersOmanOther small statesPacific island small statesPakistanPalauPanamaPapua New GuineaParaguayPeruPhilippinesPolandPortugalPost-demographic dividendPre-demographic dividendQatarRomaniaRussian FederationRwandaSamoaSao Tome and PrincipeSaudi ArabiaSenegalSerbiaSeychellesSierra LeoneSingaporeSlovak RepublicSloveniaSmall statesSolomon IslandsSomaliaSouth AfricaSouth AsiaSouth Asia (IDA & IBRD)SpainSri LankaSt. Kitts and NevisSt. LuciaSt. Vincent and the GrenadinesSub-Saharan Africa Sub-Saharan Africa (excluding high income)Sub-Saharan Africa (IDA & IBRD countries)SudanSurinameSwazilandSwedenSwitzerlandSyrian Arab RepublicTajikistanTanzaniaThailandTimor-LesteTogoTongaTrinidad and TobagoTunisiaTurkeyTurkmenistanTurks and Caicos IslandsTuvaluUgandaUkraineUnited Arab EmiratesUnited KingdomUnited StatesUpper middle incomeUruguayVanuatuVenezuela, RBVietnamVirgin Islands (U.S.)WorldYemen, Rep.ZambiaZimbabwe Timeline:
This timeline shows a graph from 1963 to 2016 of Argentina. No data until 1962. Number of actual observations by date: 54.
Source name:
World Development Indicators
Source organization:
World Bank staff estimates from the Comtrade database maintained by the United Nations Statistics Division.
Categories, topics:
Energy & Mining, Private Sector, Trade
Last updated:
apr 23, 2017
Indicators value changes by year
Maximum:
17.738
jan 1, 2001
At the date of observation
Value
Absolute change
Change from previous value
jan 1, 1963
1.081
+1.081
0.0%
jan 1, 1964
0.823
-0.258
-23.89%
jan 1, 1965
0.432
-0.39
-47.45%
jan 1, 1966
0.616
+0.183
42.4%
jan 1, 1967
0.879
+0.263
42.73%
jan 1, 1968
0.525
-0.353
-40.22%
jan 1, 1969
0.906
+0.381
72.47%
jan 1, 1970
0.359
-0.547
-60.39%
jan 1, 1971
0.43
+0.071
19.84%
jan 1, 1972
0.488
+0.058
13.5%
jan 1, 1973
0.322
-0.166
-33.93%
jan 1, 1974
0.171
-0.151
-46.84%
jan 1, 1975
0.314
+0.143
83.25%
jan 1, 1976
0.495
+0.181
57.58%
jan 1, 1977
0.503
+0.008
1.63%
jan 1, 1978
0.492
-0.011
-2.12%
jan 1, 1979
0.807
+0.315
63.94%
jan 1, 1980
0.622
-0.186
-23.0%
jan 1, 1981
3.464
+2.843
457.38%
jan 1, 1982
6.781
+3.317
95.74%
jan 1, 1983
7.188
+0.407
6.0%
jan 1, 1984
4.266
-2.922
-40.65%
jan 1, 1985
4.091
-0.175
-4.1%
jan 1, 1986
7.307
+3.216
78.61%
jan 1, 1987
2.241
-5.066
-69.33%
jan 1, 1988
1.343
-0.898
-40.08%
jan 1, 1989
1.525
+0.182
13.53%
jan 1, 1990
3.387
+1.862
122.14%
jan 1, 1991
7.801
+4.414
130.31%
jan 1, 1992
6.256
-1.545
-19.8%
jan 1, 1993
8.722
+2.465
39.41%
jan 1, 1994
9.465
+0.743
8.52%
jan 1, 1995
10.48
+1.015
10.73%
jan 1, 1996
10.373
-0.108
-1.03%
jan 1, 1997
12.997
+2.624
25.3%
jan 1, 1998
11.735
-1.262
-9.71%
jan 1, 1999
8.667
-3.068
-26.14%
jan 1, 2000
12.227
+3.559
41.07%
jan 1, 2001
17.738
+5.512
45.08%
jan 1, 2002
17.129
-0.61
-3.44%
jan 1, 2003
17.089
-0.04
-0.23%
jan 1, 2004
17.123
+0.034
0.2%
jan 1, 2005
15.994
-1.129
-6.59%
jan 1, 2006
16.383
+0.389
2.43%
jan 1, 2007
15.407
-0.976
-5.95%
jan 1, 2008
10.994
-4.413
-28.64%
jan 1, 2009
9.447
-1.547
-14.07%
jan 1, 2010
10.342
+0.894
9.46%
jan 1, 2011
8.128
-2.213
-21.4%
jan 1, 2012
6.12
-2.009
-24.71%
jan 1, 2013
6.375
+0.255
4.17%
jan 1, 2014
4.759
-1.616
-25.35%
jan 1, 2015
4.751
-0.008
-0.17%
jan 1, 2016
2.611
-2.14
-45.04%
Ranking of countries by current statistics by years


Comments: