29
/
en
AIzaSyAYiBZKx7MnpbEhh9jyipgxe19OcubqV5w
April 1, 2024
72962
Australia
AUS
true
2
1
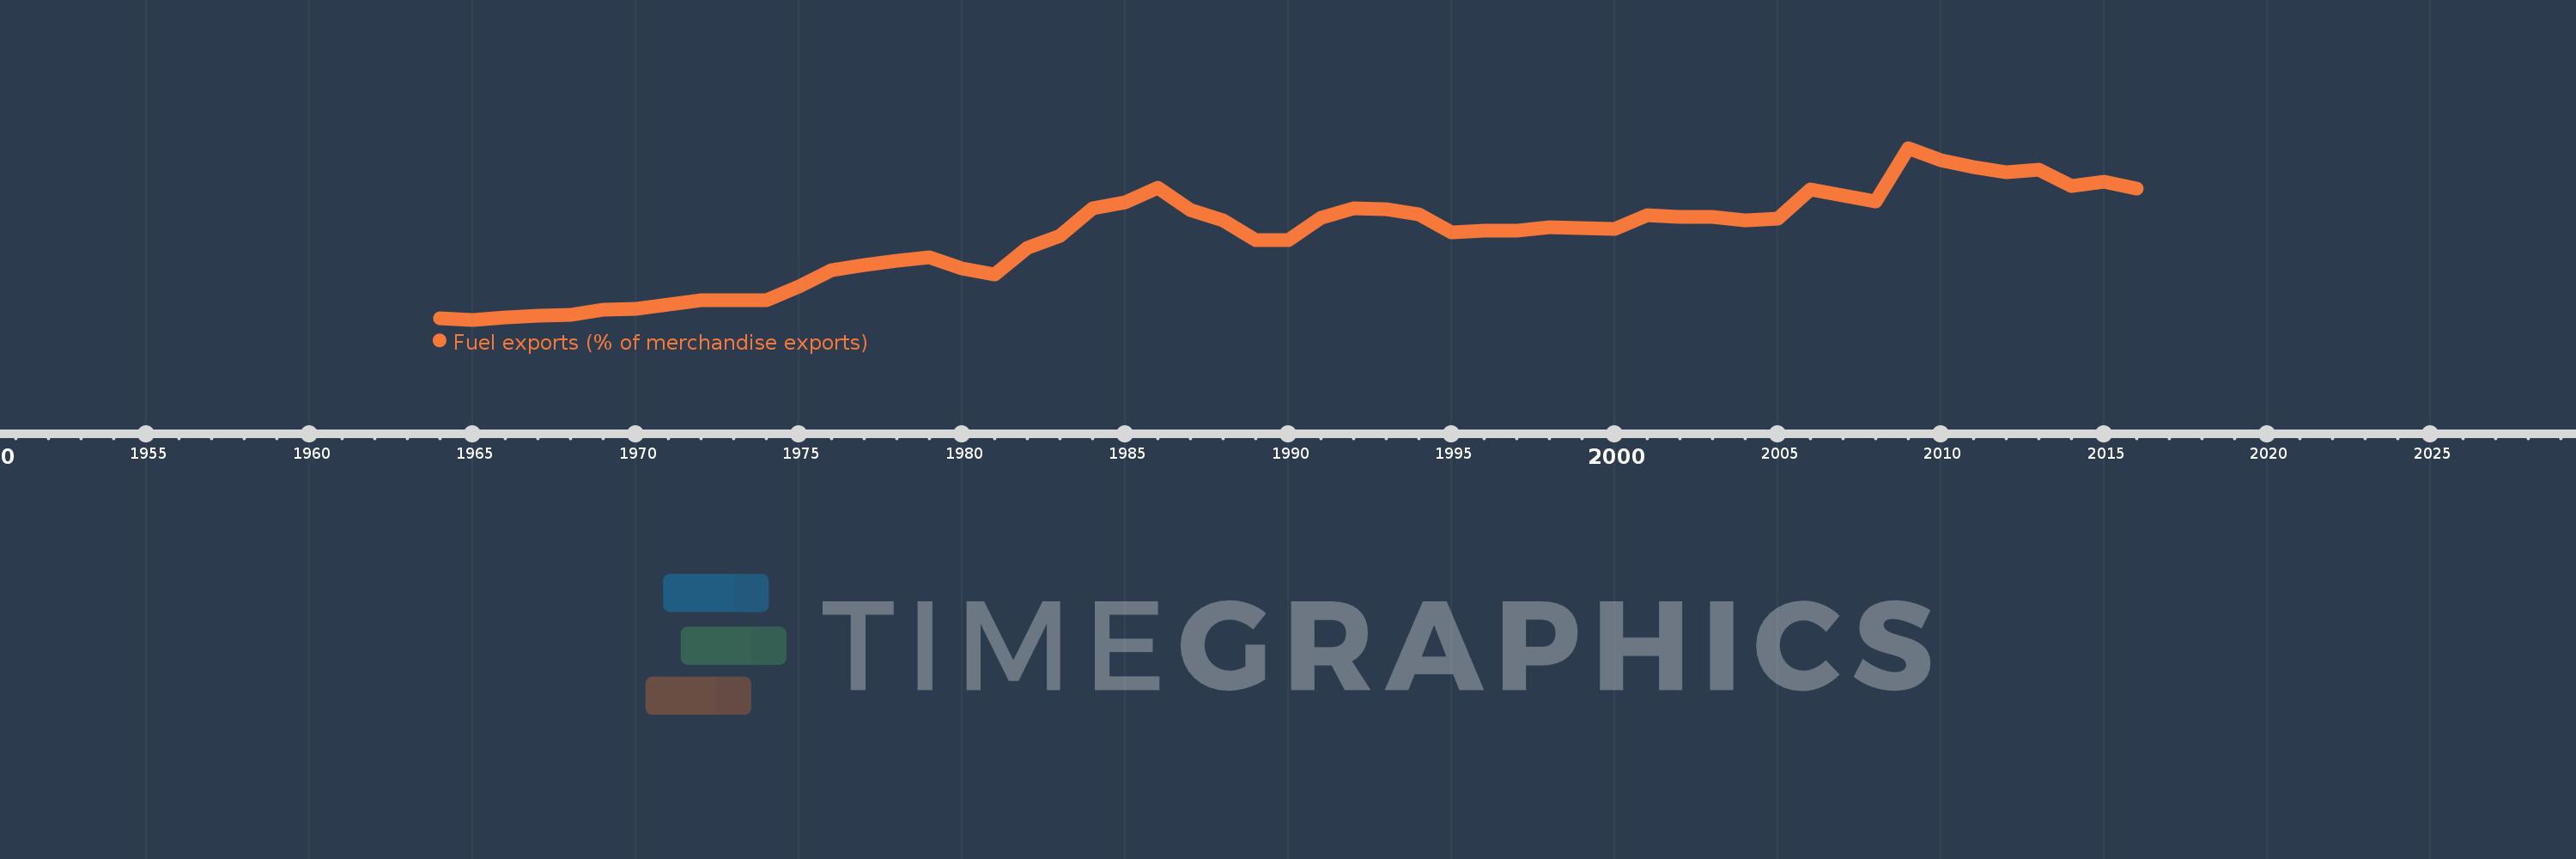
Fuel exports (% of merchandise exports)
2016,2015,2014,2013,2012,2011,2010,2009,2008,2007,2006,2005,2004,2003,2002,2001,2000,1999,1998,1997,1996,1995,1994,1993,1992,1991,1990,1989,1988,1987,1986,1985,1984,1983,1982,1981,1980,1979,1978,1977,1976,1975,1974,1973,1972,1971,1970,1969,1968,1967,1966,1965,1964
This statistics in other country:
AfghanistanAlbaniaAlgeriaAndorraAngolaAntigua and BarbudaArab WorldArgentinaArmeniaArubaAustraliaAustriaAzerbaijanBahamas, TheBahrainBangladeshBarbadosBelarusBelgiumBelizeBeninBermudaBhutanBoliviaBosnia and HerzegovinaBotswanaBrazilBrunei DarussalamBulgariaBurkina FasoBurundiCabo VerdeCambodiaCameroonCanadaCaribbean small statesCayman IslandsCentral African RepublicCentral Europe and the BalticsChadChileChinaColombiaComorosCongo, Dem. Rep.Congo, Rep.Costa RicaCote d'IvoireCroatiaCubaCyprusCzech RepublicDenmarkDjiboutiDominicaDominican RepublicEarly-demographic dividendEast Asia & PacificEast Asia & Pacific (excluding high income)East Asia & Pacific (IDA & IBRD countries)EcuadorEgypt, Arab Rep.El SalvadorEquatorial GuineaEritreaEstoniaEthiopiaEuro areaEurope & Central AsiaEurope & Central Asia (excluding high income)Europe & Central Asia (IDA & IBRD countries)European UnionFaroe IslandsFijiFinlandFragile and conflict affected situationsFranceFrench PolynesiaGabonGambia, TheGeorgiaGermanyGhanaGreeceGreenlandGrenadaGuatemalaGuineaGuinea-BissauGuyanaHaitiHeavily indebted poor countries (HIPC)High incomeHondurasHong Kong SAR, ChinaHungaryIBRD onlyIcelandIDA & IBRD totalIDA blendIDA onlyIDA totalIndiaIndonesiaIran, Islamic Rep.IraqIrelandIsraelItalyJamaicaJapanJordanKazakhstanKenyaKiribatiKorea, Rep.KuwaitKyrgyz RepublicLao PDRLate-demographic dividendLatin America & Caribbean Latin America & Caribbean (excluding high income)Latin America & the Caribbean (IDA & IBRD countries)LatviaLeast developed countries: UN classificationLebanonLesothoLiberiaLibyaLithuaniaLow & middle incomeLower middle incomeLuxembourgMacao SAR, ChinaMacedonia, FYRMadagascarMalawiMalaysiaMaldivesMaliMaltaMauritaniaMauritiusMexicoMiddle East & North AfricaMiddle East & North Africa (excluding high income)Middle East & North Africa (IDA & IBRD countries)Middle incomeMoldovaMongoliaMoroccoMozambiqueMyanmarNamibiaNepalNetherlandsNew CaledoniaNew ZealandNicaraguaNigerNigeriaNorth AmericaNorwayOECD membersOmanOther small statesPacific island small statesPakistanPalauPanamaPapua New GuineaParaguayPeruPhilippinesPolandPortugalPost-demographic dividendPre-demographic dividendQatarRomaniaRussian FederationRwandaSamoaSao Tome and PrincipeSaudi ArabiaSenegalSerbiaSeychellesSierra LeoneSingaporeSlovak RepublicSloveniaSmall statesSolomon IslandsSomaliaSouth AfricaSouth AsiaSouth Asia (IDA & IBRD)SpainSri LankaSt. Kitts and NevisSt. LuciaSt. Vincent and the GrenadinesSub-Saharan Africa Sub-Saharan Africa (excluding high income)Sub-Saharan Africa (IDA & IBRD countries)SudanSurinameSwazilandSwedenSwitzerlandSyrian Arab RepublicTajikistanTanzaniaThailandTimor-LesteTogoTongaTrinidad and TobagoTunisiaTurkeyTurkmenistanTurks and Caicos IslandsTuvaluUgandaUkraineUnited Arab EmiratesUnited KingdomUnited StatesUpper middle incomeUruguayVanuatuVenezuela, RBVietnamVirgin Islands (U.S.)WorldYemen, Rep.ZambiaZimbabwe Timeline:
This timeline shows a graph from 1964 to 2016 of Australia. No data until 1963. Number of actual observations by date: 53.
Source name:
World Development Indicators
Source organization:
World Bank staff estimates from the Comtrade database maintained by the United Nations Statistics Division.
Categories, topics:
Energy & Mining, Private Sector, Trade
Last updated:
apr 23, 2017
Indicators value changes by year
Maximum:
34.267
jan 1, 2009
At the date of observation
Value
Absolute change
Change from previous value
jan 1, 1964
3.091
+3.091
0.0%
jan 1, 1965
2.793
-0.298
-9.64%
jan 1, 1966
3.145
+0.352
12.62%
jan 1, 1967
3.474
+0.329
10.46%
jan 1, 1968
3.709
+0.235
6.76%
jan 1, 1969
4.644
+0.935
25.21%
jan 1, 1970
4.847
+0.203
4.37%
jan 1, 1971
5.585
+0.738
15.23%
jan 1, 1972
6.423
+0.838
15.01%
jan 1, 1973
6.331
-0.092
-1.44%
jan 1, 1974
6.315
-0.015
-0.24%
jan 1, 1975
8.837
+2.521
39.92%
jan 1, 1976
11.875
+3.038
34.38%
jan 1, 1977
12.763
+0.888
7.48%
jan 1, 1978
13.613
+0.85
6.66%
jan 1, 1979
14.166
+0.553
4.06%
jan 1, 1980
12.244
-1.921
-13.56%
jan 1, 1981
11.139
-1.105
-9.03%
jan 1, 1982
16.006
+4.867
43.69%
jan 1, 1983
18.22
+2.213
13.83%
jan 1, 1984
23.157
+4.937
27.1%
jan 1, 1985
24.357
+1.2
5.18%
jan 1, 1986
26.911
+2.554
10.49%
jan 1, 1987
22.829
-4.082
-15.17%
jan 1, 1988
20.938
-1.891
-8.28%
jan 1, 1989
17.33
-3.607
-17.23%
jan 1, 1990
17.395
+0.064
0.37%
jan 1, 1991
21.454
+4.06
23.34%
jan 1, 1992
23.166
+1.711
7.98%
jan 1, 1993
23.0
-0.166
-0.72%
jan 1, 1994
22.172
-0.827
-3.6%
jan 1, 1995
18.725
-3.447
-15.55%
jan 1, 1996
19.053
+0.327
1.75%
jan 1, 1997
19.064
+0.012
0.06%
jan 1, 1998
19.694
+0.63
3.3%
jan 1, 1999
19.656
-0.038
-0.19%
jan 1, 2000
19.422
-0.234
-1.19%
jan 1, 2001
21.88
+2.458
12.66%
jan 1, 2002
21.666
-0.214
-0.98%
jan 1, 2003
21.652
-0.014
-0.06%
jan 1, 2004
20.943
-0.709
-3.27%
jan 1, 2005
21.292
+0.349
1.67%
jan 1, 2006
26.732
+5.44
25.55%
jan 1, 2007
25.487
-1.245
-4.66%
jan 1, 2008
24.422
-1.065
-4.18%
jan 1, 2009
34.267
+9.845
40.31%
jan 1, 2010
31.982
-2.285
-6.67%
jan 1, 2011
30.823
-1.159
-3.62%
jan 1, 2012
29.883
-0.94
-3.05%
jan 1, 2013
30.357
+0.474
1.59%
jan 1, 2014
27.323
-3.034
-10.0%
jan 1, 2015
28.019
+0.696
2.55%
jan 1, 2016
26.864
-1.155
-4.12%
Ranking of countries by current statistics by years


Comments: