29
/
en
AIzaSyAYiBZKx7MnpbEhh9jyipgxe19OcubqV5w
April 1, 2024
45078
Low & middle income
LMY
false
2
1
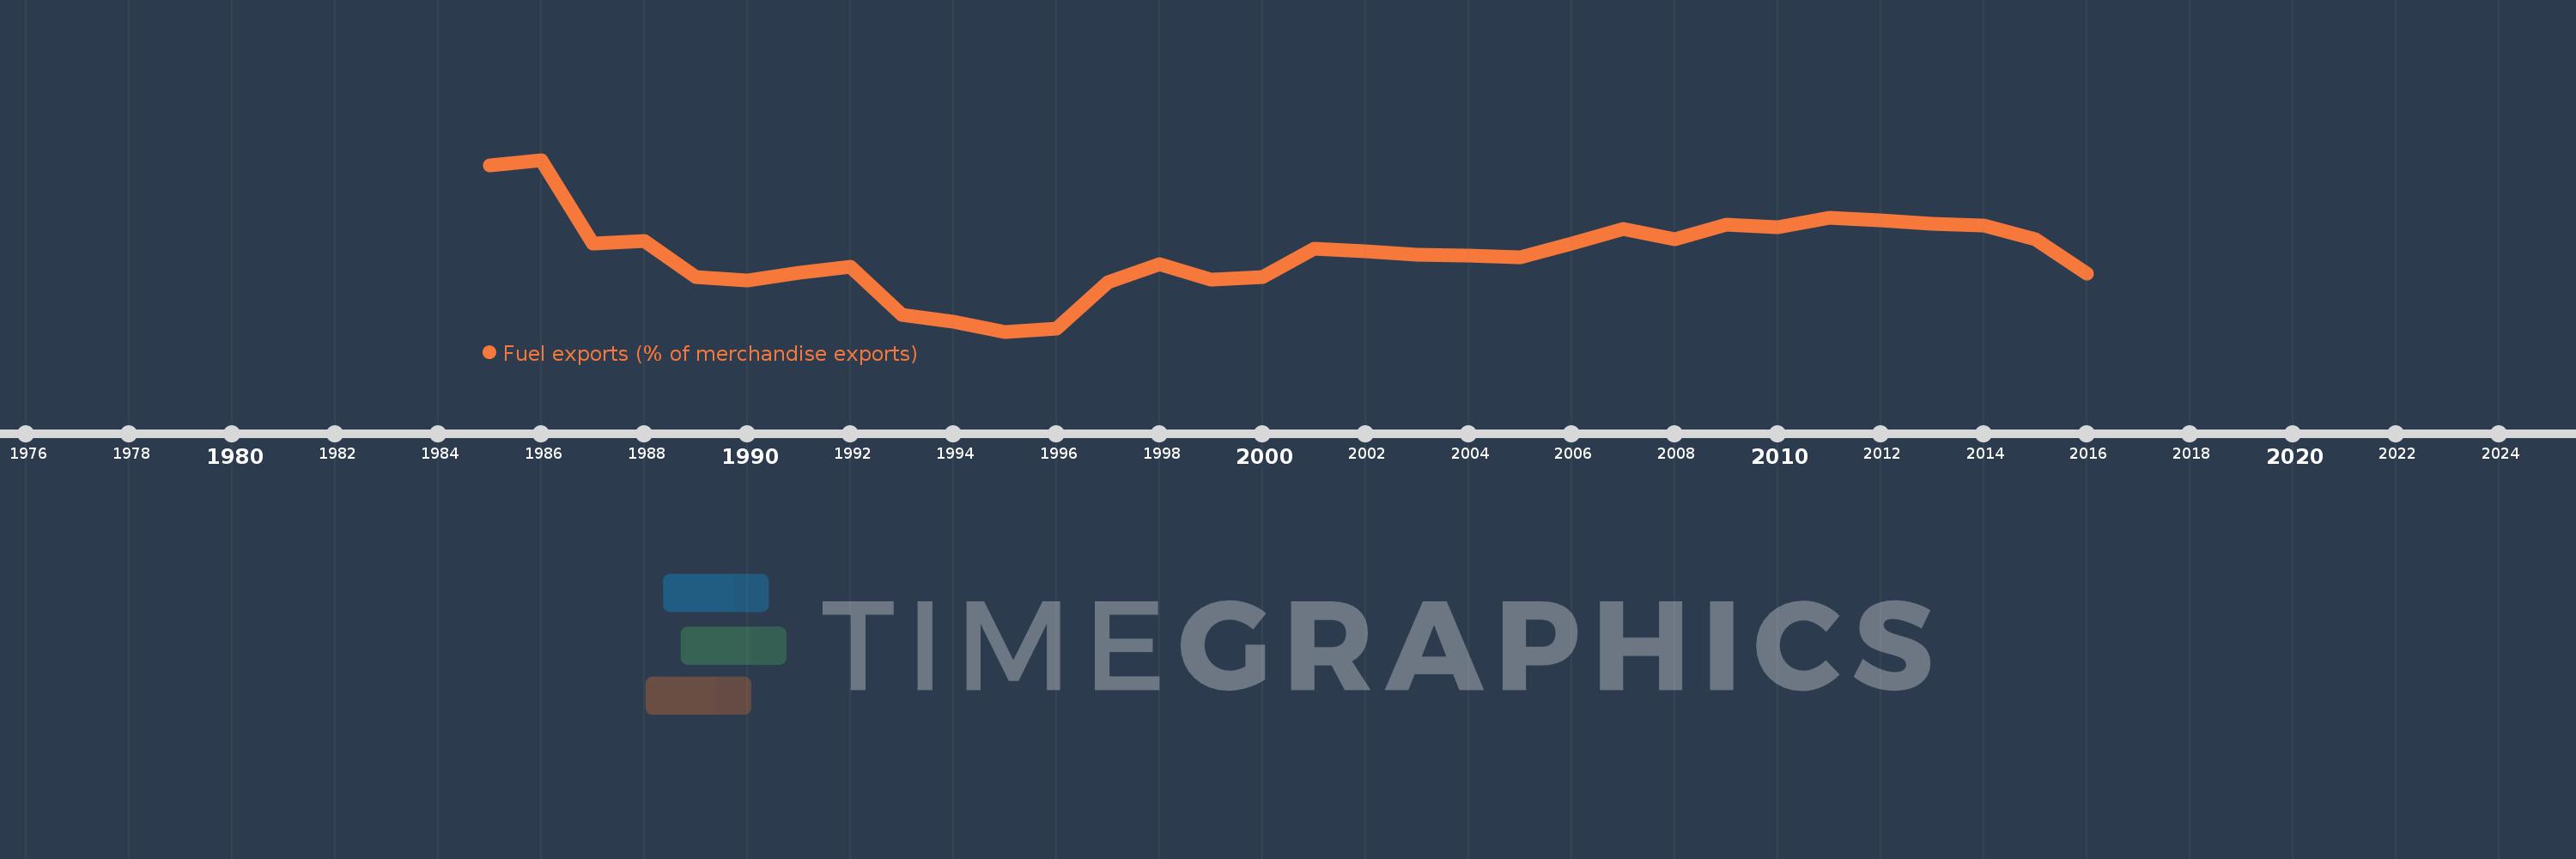
Fuel exports (% of merchandise exports)
2016,2015,2014,2013,2012,2011,2010,2009,2008,2007,2006,2005,2004,2003,2002,2001,2000,1999,1998,1997,1996,1995,1994,1993,1992,1991,1990,1989,1988,1987,1986,1985
This statistics in other country:
AfghanistanAlbaniaAlgeriaAndorraAngolaAntigua and BarbudaArab WorldArgentinaArmeniaArubaAustraliaAustriaAzerbaijanBahamas, TheBahrainBangladeshBarbadosBelarusBelgiumBelizeBeninBermudaBhutanBoliviaBosnia and HerzegovinaBotswanaBrazilBrunei DarussalamBulgariaBurkina FasoBurundiCabo VerdeCambodiaCameroonCanadaCaribbean small statesCayman IslandsCentral African RepublicCentral Europe and the BalticsChadChileChinaColombiaComorosCongo, Dem. Rep.Congo, Rep.Costa RicaCote d'IvoireCroatiaCubaCyprusCzech RepublicDenmarkDjiboutiDominicaDominican RepublicEarly-demographic dividendEast Asia & PacificEast Asia & Pacific (excluding high income)East Asia & Pacific (IDA & IBRD countries)EcuadorEgypt, Arab Rep.El SalvadorEquatorial GuineaEritreaEstoniaEthiopiaEuro areaEurope & Central AsiaEurope & Central Asia (excluding high income)Europe & Central Asia (IDA & IBRD countries)European UnionFaroe IslandsFijiFinlandFragile and conflict affected situationsFranceFrench PolynesiaGabonGambia, TheGeorgiaGermanyGhanaGreeceGreenlandGrenadaGuatemalaGuineaGuinea-BissauGuyanaHaitiHeavily indebted poor countries (HIPC)High incomeHondurasHong Kong SAR, ChinaHungaryIBRD onlyIcelandIDA & IBRD totalIDA blendIDA onlyIDA totalIndiaIndonesiaIran, Islamic Rep.IraqIrelandIsraelItalyJamaicaJapanJordanKazakhstanKenyaKiribatiKorea, Rep.KuwaitKyrgyz RepublicLao PDRLate-demographic dividendLatin America & Caribbean Latin America & Caribbean (excluding high income)Latin America & the Caribbean (IDA & IBRD countries)LatviaLeast developed countries: UN classificationLebanonLesothoLiberiaLibyaLithuaniaLow & middle incomeLower middle incomeLuxembourgMacao SAR, ChinaMacedonia, FYRMadagascarMalawiMalaysiaMaldivesMaliMaltaMauritaniaMauritiusMexicoMiddle East & North AfricaMiddle East & North Africa (excluding high income)Middle East & North Africa (IDA & IBRD countries)Middle incomeMoldovaMongoliaMoroccoMozambiqueMyanmarNamibiaNepalNetherlandsNew CaledoniaNew ZealandNicaraguaNigerNigeriaNorth AmericaNorwayOECD membersOmanOther small statesPacific island small statesPakistanPalauPanamaPapua New GuineaParaguayPeruPhilippinesPolandPortugalPost-demographic dividendPre-demographic dividendQatarRomaniaRussian FederationRwandaSamoaSao Tome and PrincipeSaudi ArabiaSenegalSerbiaSeychellesSierra LeoneSingaporeSlovak RepublicSloveniaSmall statesSolomon IslandsSomaliaSouth AfricaSouth AsiaSouth Asia (IDA & IBRD)SpainSri LankaSt. Kitts and NevisSt. LuciaSt. Vincent and the GrenadinesSub-Saharan Africa Sub-Saharan Africa (excluding high income)Sub-Saharan Africa (IDA & IBRD countries)SudanSurinameSwazilandSwedenSwitzerlandSyrian Arab RepublicTajikistanTanzaniaThailandTimor-LesteTogoTongaTrinidad and TobagoTunisiaTurkeyTurkmenistanTurks and Caicos IslandsTuvaluUgandaUkraineUnited Arab EmiratesUnited KingdomUnited StatesUpper middle incomeUruguayVanuatuVenezuela, RBVietnamVirgin Islands (U.S.)WorldYemen, Rep.ZambiaZimbabwe Timeline:
This timeline shows a graph from 1985 to 2016 of Low & middle income. No data until 1984. Number of actual observations by date: 32.
Source name:
World Development Indicators
Source organization:
World Bank staff estimates from the Comtrade database maintained by the United Nations Statistics Division.
Categories, topics:
Energy & Mining, Private Sector, Trade
Last updated:
apr 23, 2017
Indicators value changes by year
Maximum:
30.241
jan 1, 1986
At the date of observation
Value
Absolute change
Change from previous value
jan 1, 1985
29.521
+29.521
0.0%
jan 1, 1986
30.241
+0.72
2.44%
jan 1, 1987
19.823
-10.418
-34.45%
jan 1, 1988
20.169
+0.346
1.75%
jan 1, 1989
15.677
-4.492
-22.27%
jan 1, 1990
15.225
-0.453
-2.89%
jan 1, 1991
16.17
+0.946
6.21%
jan 1, 1992
16.91
+0.74
4.57%
jan 1, 1993
11.01
-5.9
-34.89%
jan 1, 1994
10.105
-0.905
-8.22%
jan 1, 1995
8.893
-1.212
-11.99%
jan 1, 1996
9.225
+0.332
3.73%
jan 1, 1997
14.998
+5.773
62.58%
jan 1, 1998
17.266
+2.268
15.12%
jan 1, 1999
15.344
-1.922
-11.13%
jan 1, 2000
15.722
+0.378
2.46%
jan 1, 2001
19.156
+3.435
21.85%
jan 1, 2002
18.924
-0.232
-1.21%
jan 1, 2003
18.414
-0.509
-2.69%
jan 1, 2004
18.291
-0.124
-0.67%
jan 1, 2005
18.151
-0.14
-0.77%
jan 1, 2006
19.845
+1.694
9.33%
jan 1, 2007
21.651
+1.806
9.1%
jan 1, 2008
20.416
-1.235
-5.7%
jan 1, 2009
22.217
+1.802
8.82%
jan 1, 2010
21.854
-0.363
-1.64%
jan 1, 2011
23.044
+1.19
5.45%
jan 1, 2012
22.671
-0.373
-1.62%
jan 1, 2013
22.281
-0.39
-1.72%
jan 1, 2014
22.097
-0.184
-0.83%
jan 1, 2015
20.42
-1.677
-7.59%
jan 1, 2016
16.08
-4.34
-21.26%
Ranking of countries by current statistics by years


Comments: