29
/
en
AIzaSyAYiBZKx7MnpbEhh9jyipgxe19OcubqV5w
April 1, 2024
52602
OECD members
OED
false
2
1
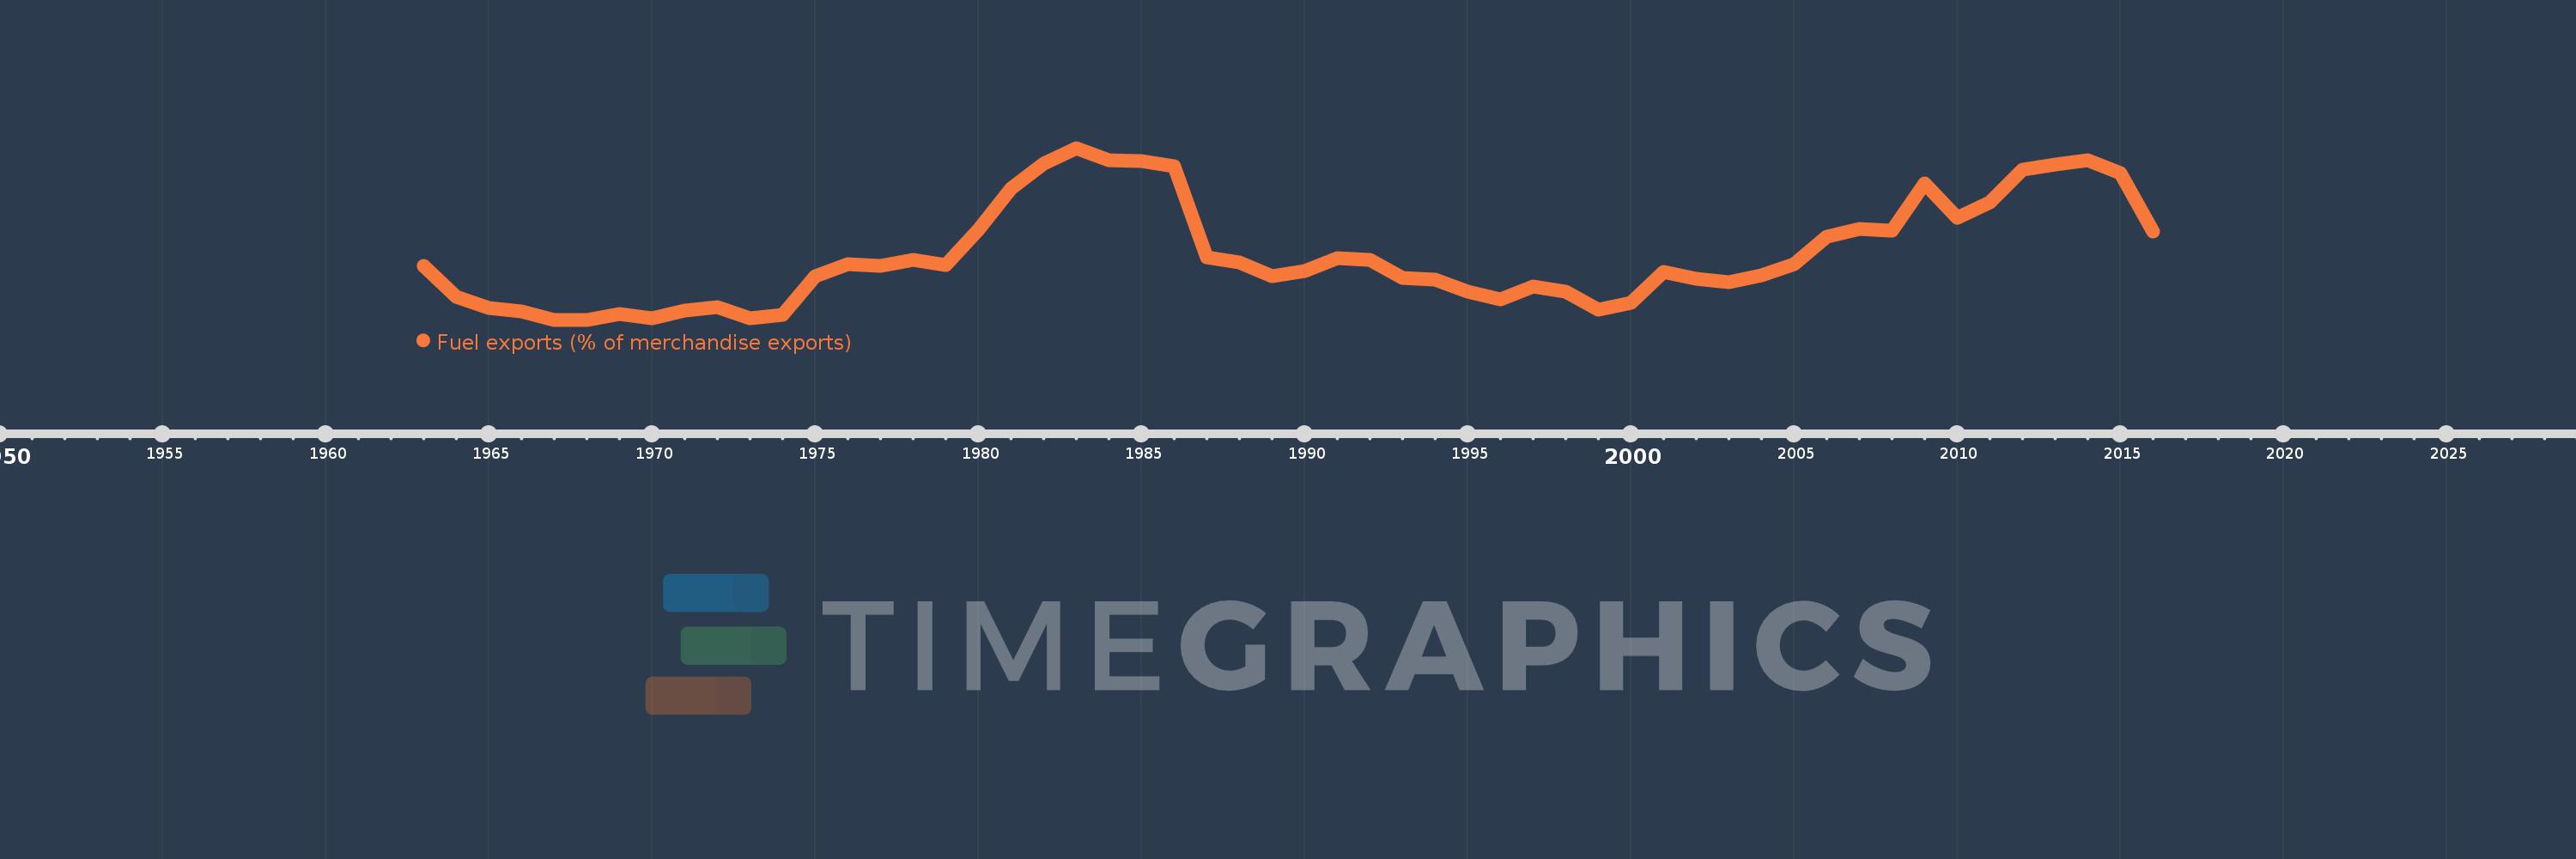
Fuel exports (% of merchandise exports)
2016,2015,2014,2013,2012,2011,2010,2009,2008,2007,2006,2005,2004,2003,2002,2001,2000,1999,1998,1997,1996,1995,1994,1993,1992,1991,1990,1989,1988,1987,1986,1985,1984,1983,1982,1981,1980,1979,1978,1977,1976,1975,1974,1973,1972,1971,1970,1969,1968,1967,1966,1965,1964,1963
This statistics in other country:
AfghanistanAlbaniaAlgeriaAndorraAngolaAntigua and BarbudaArab WorldArgentinaArmeniaArubaAustraliaAustriaAzerbaijanBahamas, TheBahrainBangladeshBarbadosBelarusBelgiumBelizeBeninBermudaBhutanBoliviaBosnia and HerzegovinaBotswanaBrazilBrunei DarussalamBulgariaBurkina FasoBurundiCabo VerdeCambodiaCameroonCanadaCaribbean small statesCayman IslandsCentral African RepublicCentral Europe and the BalticsChadChileChinaColombiaComorosCongo, Dem. Rep.Congo, Rep.Costa RicaCote d'IvoireCroatiaCubaCyprusCzech RepublicDenmarkDjiboutiDominicaDominican RepublicEarly-demographic dividendEast Asia & PacificEast Asia & Pacific (excluding high income)East Asia & Pacific (IDA & IBRD countries)EcuadorEgypt, Arab Rep.El SalvadorEquatorial GuineaEritreaEstoniaEthiopiaEuro areaEurope & Central AsiaEurope & Central Asia (excluding high income)Europe & Central Asia (IDA & IBRD countries)European UnionFaroe IslandsFijiFinlandFragile and conflict affected situationsFranceFrench PolynesiaGabonGambia, TheGeorgiaGermanyGhanaGreeceGreenlandGrenadaGuatemalaGuineaGuinea-BissauGuyanaHaitiHeavily indebted poor countries (HIPC)High incomeHondurasHong Kong SAR, ChinaHungaryIBRD onlyIcelandIDA & IBRD totalIDA blendIDA onlyIDA totalIndiaIndonesiaIran, Islamic Rep.IraqIrelandIsraelItalyJamaicaJapanJordanKazakhstanKenyaKiribatiKorea, Rep.KuwaitKyrgyz RepublicLao PDRLate-demographic dividendLatin America & Caribbean Latin America & Caribbean (excluding high income)Latin America & the Caribbean (IDA & IBRD countries)LatviaLeast developed countries: UN classificationLebanonLesothoLiberiaLibyaLithuaniaLow & middle incomeLower middle incomeLuxembourgMacao SAR, ChinaMacedonia, FYRMadagascarMalawiMalaysiaMaldivesMaliMaltaMauritaniaMauritiusMexicoMiddle East & North AfricaMiddle East & North Africa (excluding high income)Middle East & North Africa (IDA & IBRD countries)Middle incomeMoldovaMongoliaMoroccoMozambiqueMyanmarNamibiaNepalNetherlandsNew CaledoniaNew ZealandNicaraguaNigerNigeriaNorth AmericaNorwayOECD membersOmanOther small statesPacific island small statesPakistanPalauPanamaPapua New GuineaParaguayPeruPhilippinesPolandPortugalPost-demographic dividendPre-demographic dividendQatarRomaniaRussian FederationRwandaSamoaSao Tome and PrincipeSaudi ArabiaSenegalSerbiaSeychellesSierra LeoneSingaporeSlovak RepublicSloveniaSmall statesSolomon IslandsSomaliaSouth AfricaSouth AsiaSouth Asia (IDA & IBRD)SpainSri LankaSt. Kitts and NevisSt. LuciaSt. Vincent and the GrenadinesSub-Saharan Africa Sub-Saharan Africa (excluding high income)Sub-Saharan Africa (IDA & IBRD countries)SudanSurinameSwazilandSwedenSwitzerlandSyrian Arab RepublicTajikistanTanzaniaThailandTimor-LesteTogoTongaTrinidad and TobagoTunisiaTurkeyTurkmenistanTurks and Caicos IslandsTuvaluUgandaUkraineUnited Arab EmiratesUnited KingdomUnited StatesUpper middle incomeUruguayVanuatuVenezuela, RBVietnamVirgin Islands (U.S.)WorldYemen, Rep.ZambiaZimbabwe Timeline:
This timeline shows a graph from 1963 to 2016 of OECD members. No data until 1962. Number of actual observations by date: 54.
Source name:
World Development Indicators
Source organization:
World Bank staff estimates from the Comtrade database maintained by the United Nations Statistics Division.
Categories, topics:
Energy & Mining, Private Sector, Trade
Last updated:
apr 23, 2017
Indicators value changes by year
Maximum:
10.255
jan 1, 1983
At the date of observation
Value
Absolute change
Change from previous value
jan 1, 1963
5.335
+5.335
0.0%
jan 1, 1964
4.056
-1.278
-23.96%
jan 1, 1965
3.584
-0.472
-11.64%
jan 1, 1966
3.431
-0.154
-4.29%
jan 1, 1967
3.095
-0.336
-9.78%
jan 1, 1968
3.096
+0.001
0.05%
jan 1, 1969
3.334
+0.238
7.67%
jan 1, 1970
3.161
-0.173
-5.19%
jan 1, 1971
3.466
+0.305
9.66%
jan 1, 1972
3.621
+0.155
4.47%
jan 1, 1973
3.165
-0.457
-12.61%
jan 1, 1974
3.314
+0.149
4.7%
jan 1, 1975
4.913
+1.599
48.26%
jan 1, 1976
5.417
+0.505
10.27%
jan 1, 1977
5.332
-0.085
-1.57%
jan 1, 1978
5.583
+0.25
4.69%
jan 1, 1979
5.362
-0.22
-3.95%
jan 1, 1980
6.836
+1.473
27.47%
jan 1, 1981
8.554
+1.718
25.14%
jan 1, 1982
9.611
+1.057
12.36%
jan 1, 1983
10.255
+0.644
6.7%
jan 1, 1984
9.753
-0.502
-4.9%
jan 1, 1985
9.714
-0.039
-0.4%
jan 1, 1986
9.48
-0.233
-2.4%
jan 1, 1987
5.683
-3.798
-40.06%
jan 1, 1988
5.498
-0.184
-3.24%
jan 1, 1989
4.907
-0.592
-10.76%
jan 1, 1990
5.121
+0.214
4.36%
jan 1, 1991
5.676
+0.555
10.84%
jan 1, 1992
5.597
-0.079
-1.39%
jan 1, 1993
4.838
-0.759
-13.57%
jan 1, 1994
4.757
-0.081
-1.67%
jan 1, 1995
4.255
-0.502
-10.55%
jan 1, 1996
3.951
-0.304
-7.15%
jan 1, 1997
4.482
+0.53
13.43%
jan 1, 1998
4.271
-0.21
-4.7%
jan 1, 1999
3.517
-0.755
-17.67%
jan 1, 2000
3.809
+0.293
8.33%
jan 1, 2001
5.079
+1.27
33.34%
jan 1, 2002
4.785
-0.294
-5.79%
jan 1, 2003
4.644
-0.142
-2.96%
jan 1, 2004
4.963
+0.32
6.88%
jan 1, 2005
5.423
+0.459
9.25%
jan 1, 2006
6.545
+1.122
20.7%
jan 1, 2007
6.895
+0.35
5.35%
jan 1, 2008
6.821
-0.073
-1.06%
jan 1, 2009
8.776
+1.954
28.65%
jan 1, 2010
7.348
-1.428
-16.27%
jan 1, 2011
7.988
+0.64
8.71%
jan 1, 2012
9.362
+1.374
17.2%
jan 1, 2013
9.558
+0.196
2.09%
jan 1, 2014
9.742
+0.184
1.92%
jan 1, 2015
9.19
-0.552
-5.67%
jan 1, 2016
6.787
-2.403
-26.15%
Ranking of countries by current statistics by years


Comments: