29
/
en
AIzaSyAYiBZKx7MnpbEhh9jyipgxe19OcubqV5w
April 1, 2024
154589
India
IND
true
2
1
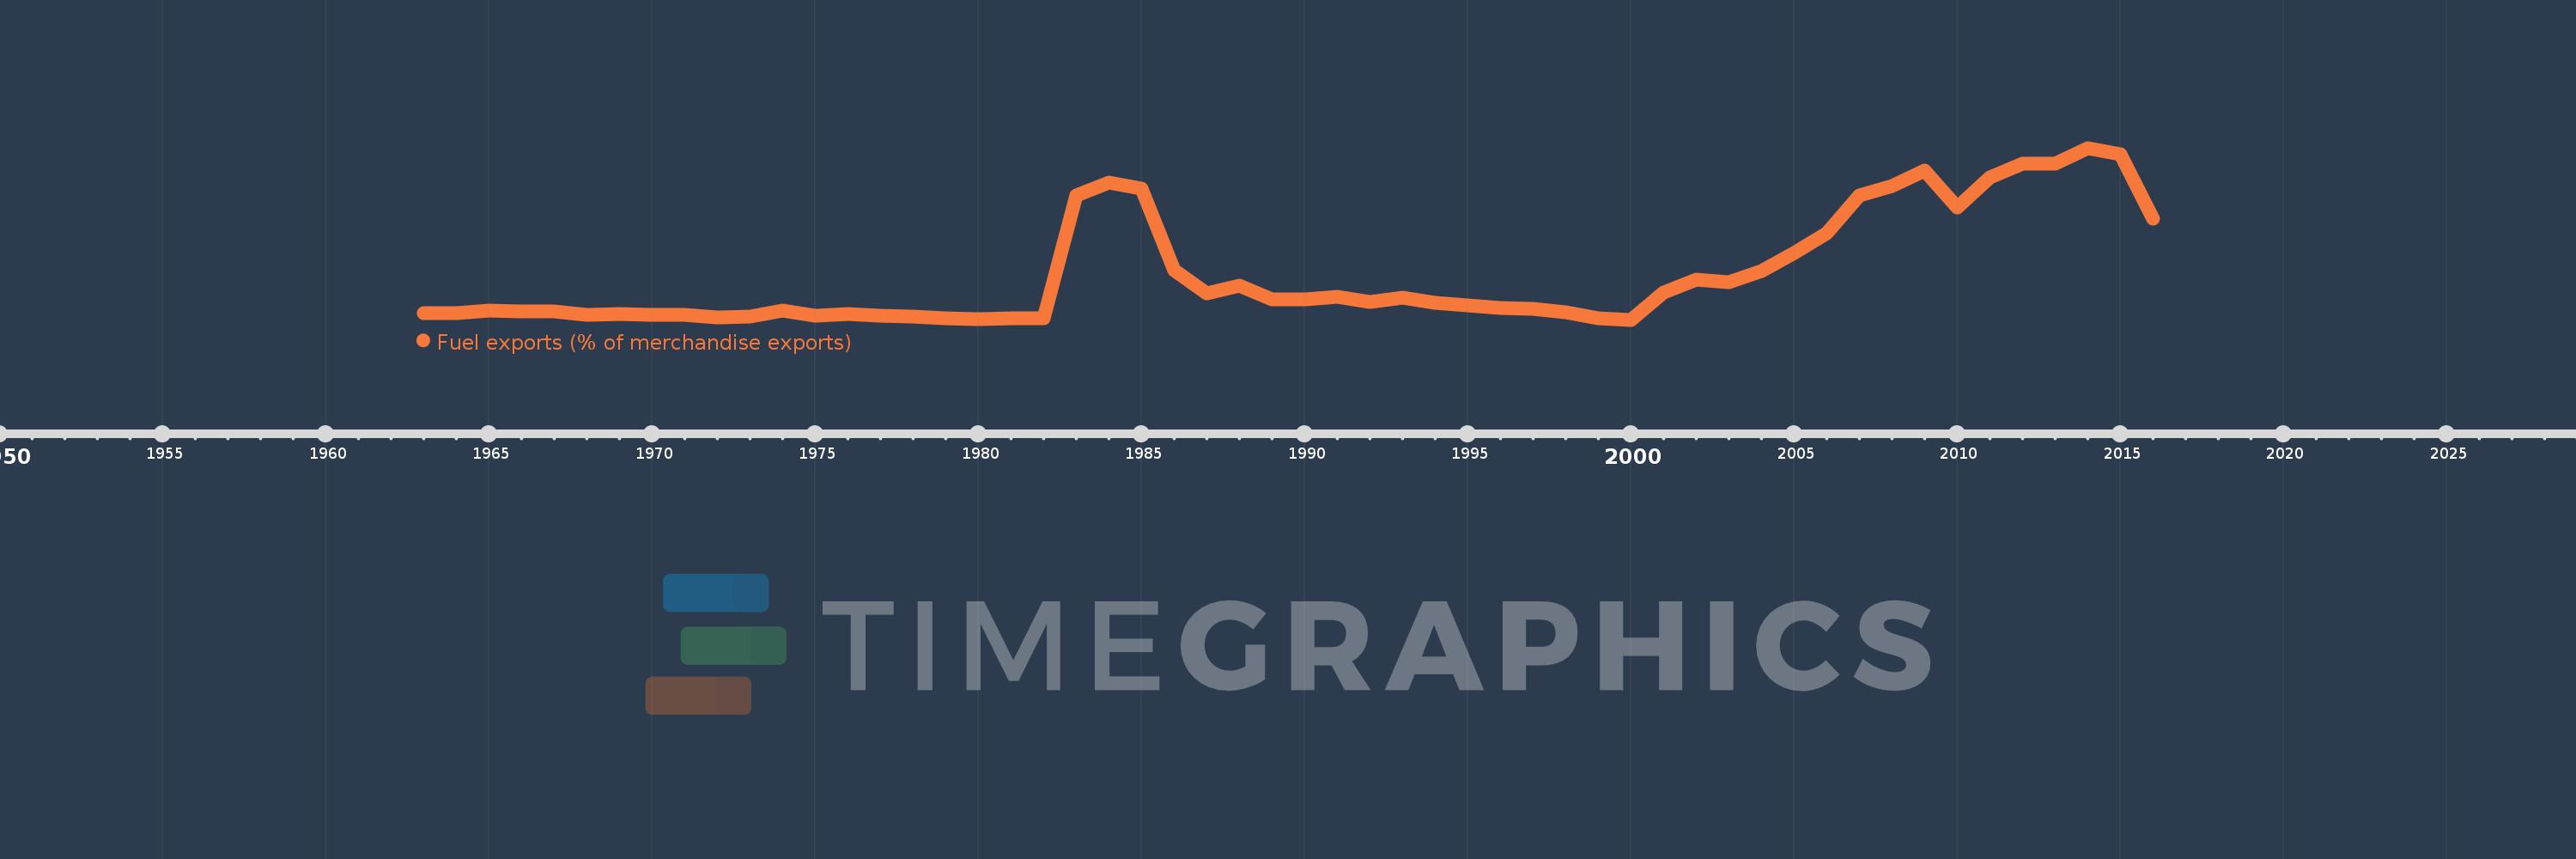
Fuel exports (% of merchandise exports)
2016,2015,2014,2013,2012,2011,2010,2009,2008,2007,2006,2005,2004,2003,2002,2001,2000,1999,1998,1997,1996,1995,1994,1993,1992,1991,1990,1989,1988,1987,1986,1985,1984,1983,1982,1981,1980,1979,1978,1977,1976,1975,1974,1973,1972,1971,1970,1969,1968,1967,1966,1965,1964,1963
This statistics in other country:
AfghanistanAlbaniaAlgeriaAndorraAngolaAntigua and BarbudaArab WorldArgentinaArmeniaArubaAustraliaAustriaAzerbaijanBahamas, TheBahrainBangladeshBarbadosBelarusBelgiumBelizeBeninBermudaBhutanBoliviaBosnia and HerzegovinaBotswanaBrazilBrunei DarussalamBulgariaBurkina FasoBurundiCabo VerdeCambodiaCameroonCanadaCaribbean small statesCayman IslandsCentral African RepublicCentral Europe and the BalticsChadChileChinaColombiaComorosCongo, Dem. Rep.Congo, Rep.Costa RicaCote d'IvoireCroatiaCubaCyprusCzech RepublicDenmarkDjiboutiDominicaDominican RepublicEarly-demographic dividendEast Asia & PacificEast Asia & Pacific (excluding high income)East Asia & Pacific (IDA & IBRD countries)EcuadorEgypt, Arab Rep.El SalvadorEquatorial GuineaEritreaEstoniaEthiopiaEuro areaEurope & Central AsiaEurope & Central Asia (excluding high income)Europe & Central Asia (IDA & IBRD countries)European UnionFaroe IslandsFijiFinlandFragile and conflict affected situationsFranceFrench PolynesiaGabonGambia, TheGeorgiaGermanyGhanaGreeceGreenlandGrenadaGuatemalaGuineaGuinea-BissauGuyanaHaitiHeavily indebted poor countries (HIPC)High incomeHondurasHong Kong SAR, ChinaHungaryIBRD onlyIcelandIDA & IBRD totalIDA blendIDA onlyIDA totalIndiaIndonesiaIran, Islamic Rep.IraqIrelandIsraelItalyJamaicaJapanJordanKazakhstanKenyaKiribatiKorea, Rep.KuwaitKyrgyz RepublicLao PDRLate-demographic dividendLatin America & Caribbean Latin America & Caribbean (excluding high income)Latin America & the Caribbean (IDA & IBRD countries)LatviaLeast developed countries: UN classificationLebanonLesothoLiberiaLibyaLithuaniaLow & middle incomeLower middle incomeLuxembourgMacao SAR, ChinaMacedonia, FYRMadagascarMalawiMalaysiaMaldivesMaliMaltaMauritaniaMauritiusMexicoMiddle East & North AfricaMiddle East & North Africa (excluding high income)Middle East & North Africa (IDA & IBRD countries)Middle incomeMoldovaMongoliaMoroccoMozambiqueMyanmarNamibiaNepalNetherlandsNew CaledoniaNew ZealandNicaraguaNigerNigeriaNorth AmericaNorwayOECD membersOmanOther small statesPacific island small statesPakistanPalauPanamaPapua New GuineaParaguayPeruPhilippinesPolandPortugalPost-demographic dividendPre-demographic dividendQatarRomaniaRussian FederationRwandaSamoaSao Tome and PrincipeSaudi ArabiaSenegalSerbiaSeychellesSierra LeoneSingaporeSlovak RepublicSloveniaSmall statesSolomon IslandsSomaliaSouth AfricaSouth AsiaSouth Asia (IDA & IBRD)SpainSri LankaSt. Kitts and NevisSt. LuciaSt. Vincent and the GrenadinesSub-Saharan Africa Sub-Saharan Africa (excluding high income)Sub-Saharan Africa (IDA & IBRD countries)SudanSurinameSwazilandSwedenSwitzerlandSyrian Arab RepublicTajikistanTanzaniaThailandTimor-LesteTogoTongaTrinidad and TobagoTunisiaTurkeyTurkmenistanTurks and Caicos IslandsTuvaluUgandaUkraineUnited Arab EmiratesUnited KingdomUnited StatesUpper middle incomeUruguayVanuatuVenezuela, RBVietnamVirgin Islands (U.S.)WorldYemen, Rep.ZambiaZimbabwe Timeline:
This timeline shows a graph from 1963 to 2016 of India. No data until 1962. Number of actual observations by date: 54.
Source name:
World Development Indicators
Source organization:
World Bank staff estimates from the Comtrade database maintained by the United Nations Statistics Division.
Categories, topics:
Energy & Mining, Private Sector, Trade
Last updated:
apr 23, 2017
Indicators value changes by year
Maximum:
20.349
jan 1, 2014
At the date of observation
Value
Absolute change
Change from previous value
jan 1, 1963
0.978
+0.978
0.0%
jan 1, 1964
1.016
+0.038
3.88%
jan 1, 1965
1.354
+0.338
33.24%
jan 1, 1966
1.193
-0.161
-11.86%
jan 1, 1967
1.171
-0.023
-1.91%
jan 1, 1968
0.835
-0.335
-28.66%
jan 1, 1969
0.902
+0.067
8.06%
jan 1, 1970
0.777
-0.125
-13.87%
jan 1, 1971
0.834
+0.057
7.32%
jan 1, 1972
0.536
-0.298
-35.69%
jan 1, 1973
0.651
+0.114
21.32%
jan 1, 1974
1.336
+0.686
105.36%
jan 1, 1975
0.667
-0.669
-50.07%
jan 1, 1976
0.889
+0.222
33.21%
jan 1, 1977
0.663
-0.226
-25.41%
jan 1, 1978
0.562
-0.101
-15.21%
jan 1, 1979
0.386
-0.176
-31.26%
jan 1, 1980
0.281
-0.106
-27.4%
jan 1, 1981
0.431
+0.151
53.72%
jan 1, 1982
0.428
-0.004
-0.85%
jan 1, 1983
14.814
+14.386
3.36K%
jan 1, 1984
16.328
+1.514
10.22%
jan 1, 1985
15.574
-0.754
-4.62%
jan 1, 1986
6.038
-9.536
-61.23%
jan 1, 1987
3.363
-2.676
-44.31%
jan 1, 1988
4.21
+0.848
25.22%
jan 1, 1989
2.574
-1.637
-38.87%
jan 1, 1990
2.643
+0.069
2.68%
jan 1, 1991
2.924
+0.281
10.63%
jan 1, 1992
2.363
-0.561
-19.19%
jan 1, 1993
2.813
+0.45
19.06%
jan 1, 1994
2.233
-0.58
-20.63%
jan 1, 1995
1.945
-0.287
-12.86%
jan 1, 1996
1.66
-0.285
-14.67%
jan 1, 1997
1.553
-0.107
-6.42%
jan 1, 1998
1.148
-0.405
-26.09%
jan 1, 1999
0.433
-0.715
-62.29%
jan 1, 2000
0.238
-0.195
-44.99%
jan 1, 2001
3.404
+3.165
1.33K%
jan 1, 2002
4.918
+1.514
44.49%
jan 1, 2003
4.629
-0.289
-5.88%
jan 1, 2004
5.96
+1.331
28.76%
jan 1, 2005
8.053
+2.093
35.12%
jan 1, 2006
10.328
+2.275
28.24%
jan 1, 2007
14.754
+4.426
42.86%
jan 1, 2008
15.899
+1.145
7.76%
jan 1, 2009
17.71
+1.811
11.39%
jan 1, 2010
13.386
-4.325
-24.42%
jan 1, 2011
16.945
+3.56
26.59%
jan 1, 2012
18.517
+1.571
9.27%
jan 1, 2013
18.508
-0.009
-0.05%
jan 1, 2014
20.349
+1.841
9.95%
jan 1, 2015
19.627
-0.723
-3.55%
jan 1, 2016
12.073
-7.553
-38.48%
Ranking of countries by current statistics by years


Comments: