29
/
en
AIzaSyAYiBZKx7MnpbEhh9jyipgxe19OcubqV5w
April 1, 2024
267972
Tunisia
TUN
true
2
1
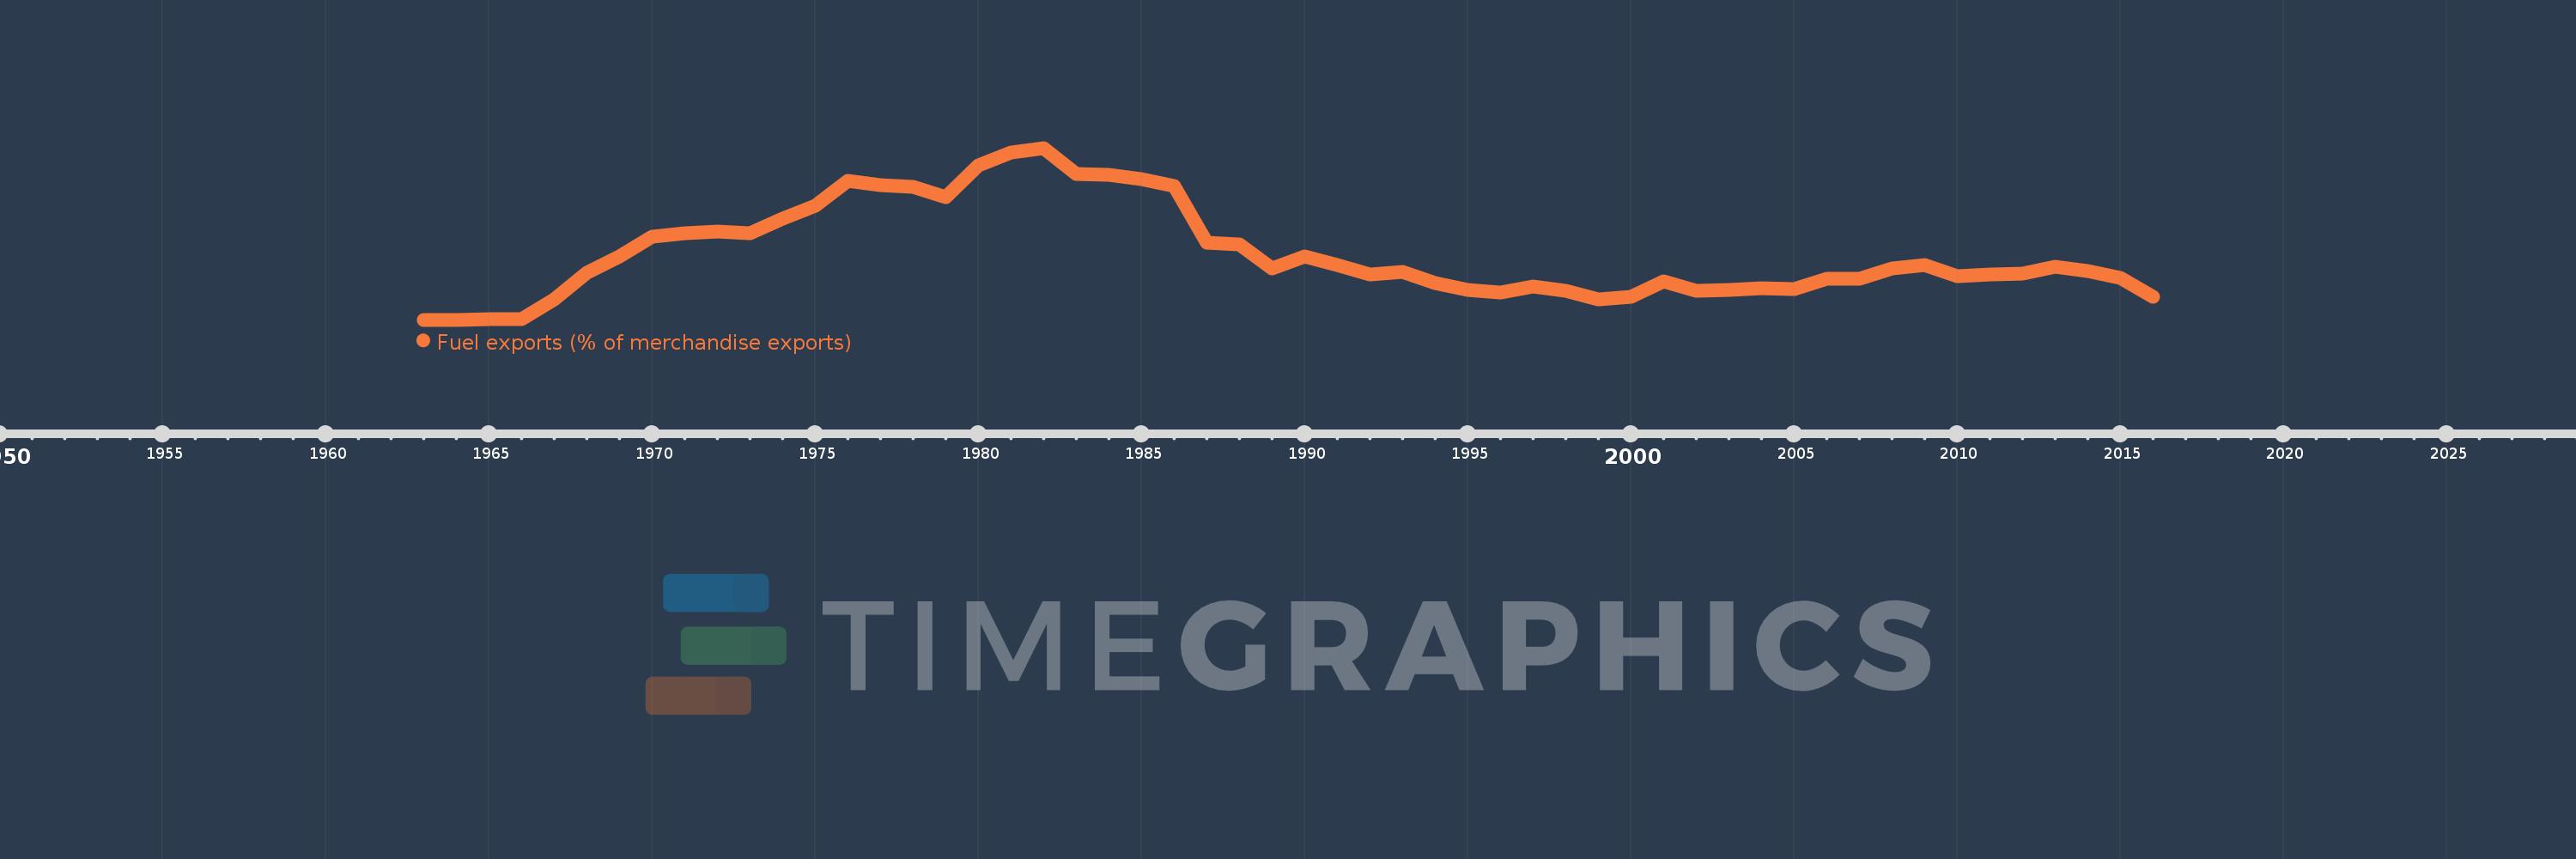
Fuel exports (% of merchandise exports)
2016,2015,2014,2013,2012,2011,2010,2009,2008,2007,2006,2005,2004,2003,2002,2001,2000,1999,1998,1997,1996,1995,1994,1993,1992,1991,1990,1989,1988,1987,1986,1985,1984,1983,1982,1981,1980,1979,1978,1977,1976,1975,1974,1973,1972,1971,1970,1969,1968,1967,1966,1965,1964,1963
This statistics in other country:
AfghanistanAlbaniaAlgeriaAndorraAngolaAntigua and BarbudaArab WorldArgentinaArmeniaArubaAustraliaAustriaAzerbaijanBahamas, TheBahrainBangladeshBarbadosBelarusBelgiumBelizeBeninBermudaBhutanBoliviaBosnia and HerzegovinaBotswanaBrazilBrunei DarussalamBulgariaBurkina FasoBurundiCabo VerdeCambodiaCameroonCanadaCaribbean small statesCayman IslandsCentral African RepublicCentral Europe and the BalticsChadChileChinaColombiaComorosCongo, Dem. Rep.Congo, Rep.Costa RicaCote d'IvoireCroatiaCubaCyprusCzech RepublicDenmarkDjiboutiDominicaDominican RepublicEarly-demographic dividendEast Asia & PacificEast Asia & Pacific (excluding high income)East Asia & Pacific (IDA & IBRD countries)EcuadorEgypt, Arab Rep.El SalvadorEquatorial GuineaEritreaEstoniaEthiopiaEuro areaEurope & Central AsiaEurope & Central Asia (excluding high income)Europe & Central Asia (IDA & IBRD countries)European UnionFaroe IslandsFijiFinlandFragile and conflict affected situationsFranceFrench PolynesiaGabonGambia, TheGeorgiaGermanyGhanaGreeceGreenlandGrenadaGuatemalaGuineaGuinea-BissauGuyanaHaitiHeavily indebted poor countries (HIPC)High incomeHondurasHong Kong SAR, ChinaHungaryIBRD onlyIcelandIDA & IBRD totalIDA blendIDA onlyIDA totalIndiaIndonesiaIran, Islamic Rep.IraqIrelandIsraelItalyJamaicaJapanJordanKazakhstanKenyaKiribatiKorea, Rep.KuwaitKyrgyz RepublicLao PDRLate-demographic dividendLatin America & Caribbean Latin America & Caribbean (excluding high income)Latin America & the Caribbean (IDA & IBRD countries)LatviaLeast developed countries: UN classificationLebanonLesothoLiberiaLibyaLithuaniaLow & middle incomeLower middle incomeLuxembourgMacao SAR, ChinaMacedonia, FYRMadagascarMalawiMalaysiaMaldivesMaliMaltaMauritaniaMauritiusMexicoMiddle East & North AfricaMiddle East & North Africa (excluding high income)Middle East & North Africa (IDA & IBRD countries)Middle incomeMoldovaMongoliaMoroccoMozambiqueMyanmarNamibiaNepalNetherlandsNew CaledoniaNew ZealandNicaraguaNigerNigeriaNorth AmericaNorwayOECD membersOmanOther small statesPacific island small statesPakistanPalauPanamaPapua New GuineaParaguayPeruPhilippinesPolandPortugalPost-demographic dividendPre-demographic dividendQatarRomaniaRussian FederationRwandaSamoaSao Tome and PrincipeSaudi ArabiaSenegalSerbiaSeychellesSierra LeoneSingaporeSlovak RepublicSloveniaSmall statesSolomon IslandsSomaliaSouth AfricaSouth AsiaSouth Asia (IDA & IBRD)SpainSri LankaSt. Kitts and NevisSt. LuciaSt. Vincent and the GrenadinesSub-Saharan Africa Sub-Saharan Africa (excluding high income)Sub-Saharan Africa (IDA & IBRD countries)SudanSurinameSwazilandSwedenSwitzerlandSyrian Arab RepublicTajikistanTanzaniaThailandTimor-LesteTogoTongaTrinidad and TobagoTunisiaTurkeyTurkmenistanTurks and Caicos IslandsTuvaluUgandaUkraineUnited Arab EmiratesUnited KingdomUnited StatesUpper middle incomeUruguayVanuatuVenezuela, RBVietnamVirgin Islands (U.S.)WorldYemen, Rep.ZambiaZimbabwe Timeline:
This timeline shows a graph from 1963 to 2016 of Tunisia. No data until 1962. Number of actual observations by date: 54.
Source name:
World Development Indicators
Source organization:
World Bank staff estimates from the Comtrade database maintained by the United Nations Statistics Division.
Categories, topics:
Energy & Mining, Private Sector, Trade
Last updated:
apr 23, 2017
Indicators value changes by year
Maximum:
54.015
jan 1, 1982
At the date of observation
Value
Absolute change
Change from previous value
jan 1, 1963
0.02
+0.02
0.0%
jan 1, 1964
0.028
+0.008
42.91%
jan 1, 1965
0.144
+0.116
417.69%
jan 1, 1966
0.115
-0.029
-20.34%
jan 1, 1967
6.394
+6.279
5.46K%
jan 1, 1968
14.859
+8.466
132.41%
jan 1, 1969
19.885
+5.025
33.82%
jan 1, 1970
26.027
+6.142
30.89%
jan 1, 1971
27.226
+1.199
4.61%
jan 1, 1972
27.796
+0.57
2.09%
jan 1, 1973
27.109
-0.686
-2.47%
jan 1, 1974
31.836
+4.727
17.44%
jan 1, 1975
35.908
+4.072
12.79%
jan 1, 1976
43.596
+7.688
21.41%
jan 1, 1977
42.355
-1.241
-2.85%
jan 1, 1978
41.886
-0.47
-1.11%
jan 1, 1979
38.495
-3.391
-8.1%
jan 1, 1980
48.583
+10.088
26.21%
jan 1, 1981
52.488
+3.905
8.04%
jan 1, 1982
54.015
+1.527
2.91%
jan 1, 1983
45.936
-8.079
-14.96%
jan 1, 1984
45.505
-0.431
-0.94%
jan 1, 1985
44.287
-1.218
-2.68%
jan 1, 1986
42.183
-2.104
-4.75%
jan 1, 1987
24.269
-17.914
-42.47%
jan 1, 1988
23.62
-0.649
-2.67%
jan 1, 1989
16.134
-7.486
-31.69%
jan 1, 1990
20.009
+3.875
24.02%
jan 1, 1991
17.277
-2.733
-13.66%
jan 1, 1992
14.32
-2.957
-17.12%
jan 1, 1993
15.102
+0.782
5.46%
jan 1, 1994
11.465
-3.637
-24.08%
jan 1, 1995
9.479
-1.986
-17.32%
jan 1, 1996
8.469
-1.01
-10.65%
jan 1, 1997
10.51
+2.04
24.09%
jan 1, 1998
9.076
-1.434
-13.64%
jan 1, 1999
6.435
-2.641
-29.1%
jan 1, 2000
7.163
+0.727
11.3%
jan 1, 2001
12.089
+4.926
68.77%
jan 1, 2002
9.239
-2.85
-23.57%
jan 1, 2003
9.365
+0.126
1.37%
jan 1, 2004
10.02
+0.655
6.99%
jan 1, 2005
9.588
-0.432
-4.31%
jan 1, 2006
12.953
+3.365
35.1%
jan 1, 2007
12.994
+0.041
0.31%
jan 1, 2008
16.208
+3.214
24.74%
jan 1, 2009
17.324
+1.116
6.89%
jan 1, 2010
13.641
-3.683
-21.26%
jan 1, 2011
14.177
+0.537
3.93%
jan 1, 2012
14.556
+0.378
2.67%
jan 1, 2013
16.788
+2.232
15.34%
jan 1, 2014
15.216
-1.572
-9.36%
jan 1, 2015
13.19
-2.026
-13.32%
jan 1, 2016
7.212
-5.978
-45.32%
Ranking of countries by current statistics by years


Comments: