29
/
en
AIzaSyAYiBZKx7MnpbEhh9jyipgxe19OcubqV5w
April 1, 2024
37352
IDA & IBRD total
IBT
false
2
1
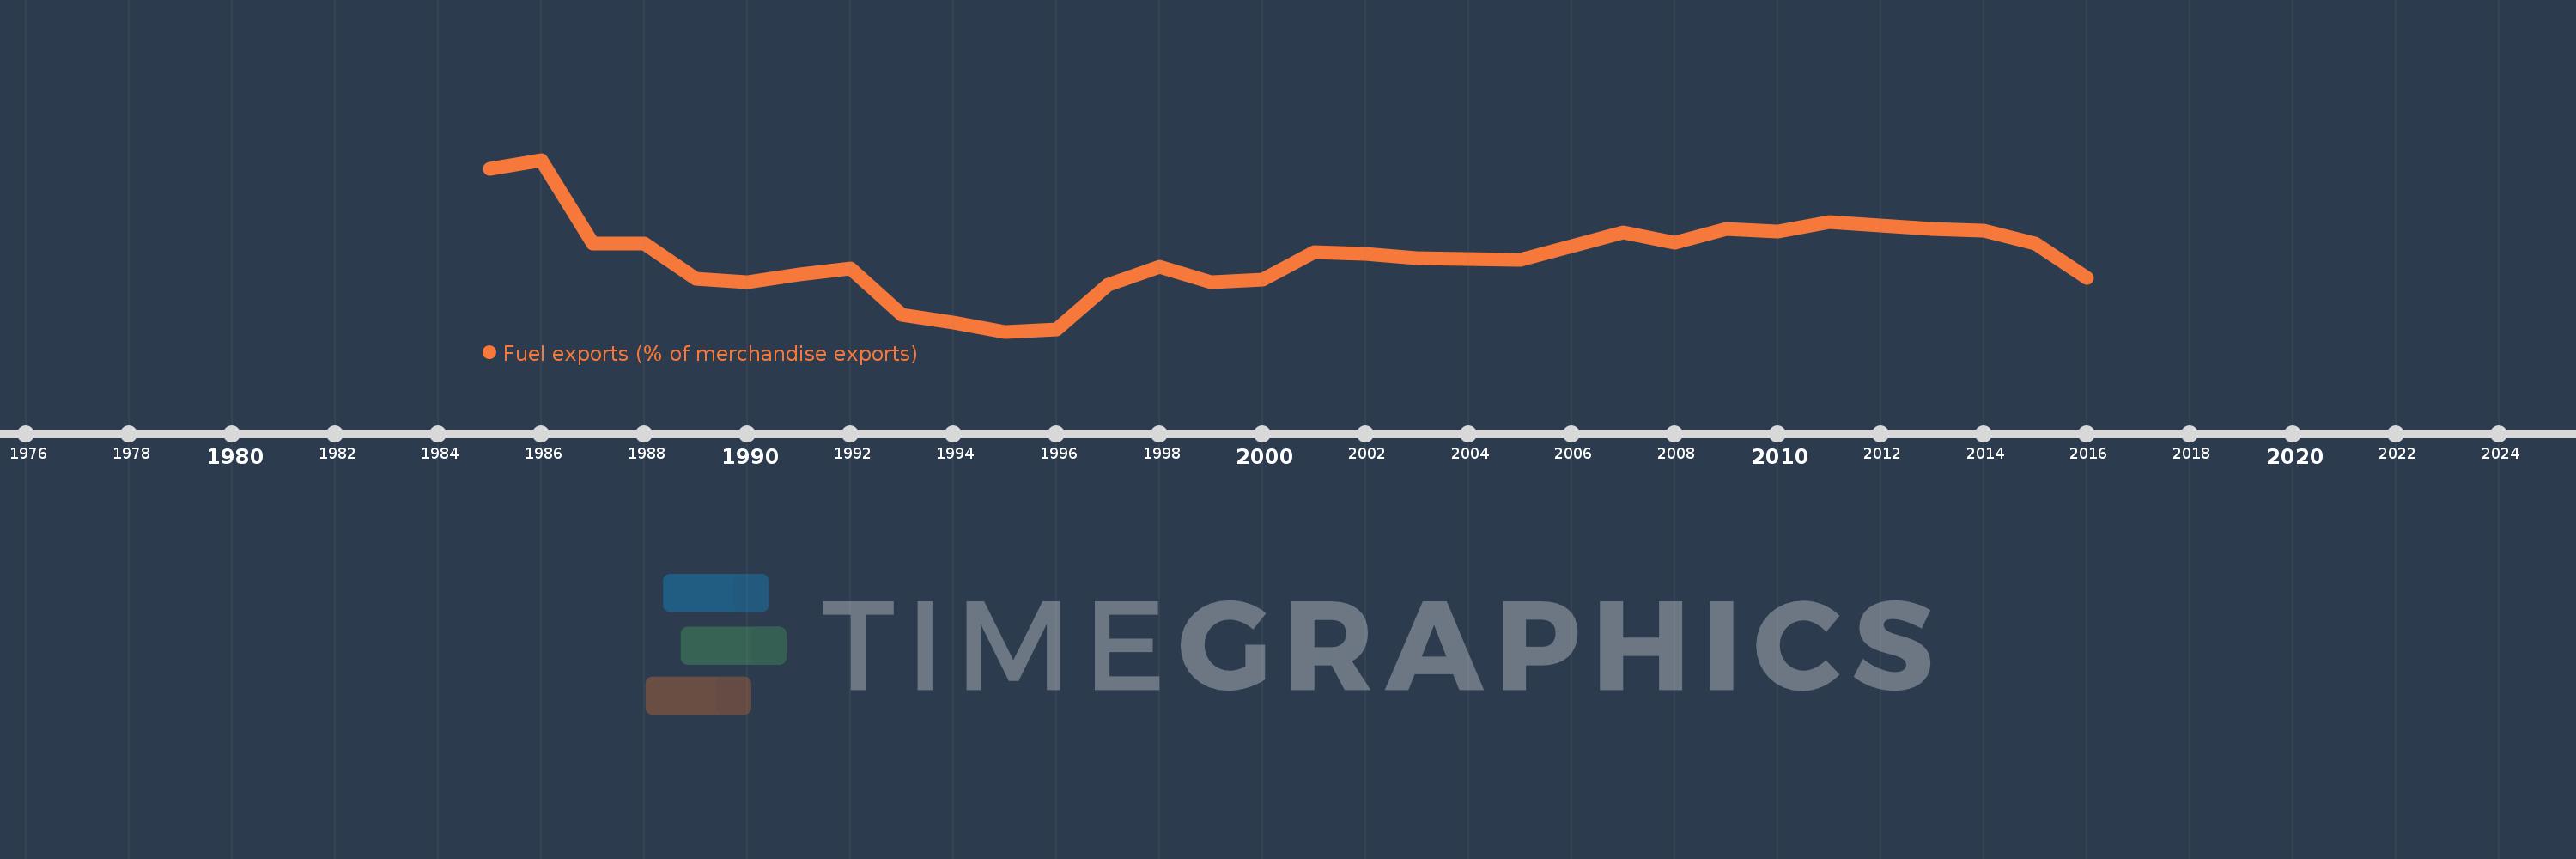
Fuel exports (% of merchandise exports)
2016,2015,2014,2013,2012,2011,2010,2009,2008,2007,2006,2005,2004,2003,2002,2001,2000,1999,1998,1997,1996,1995,1994,1993,1992,1991,1990,1989,1988,1987,1986,1985
This statistics in other country:
AfghanistanAlbaniaAlgeriaAndorraAngolaAntigua and BarbudaArab WorldArgentinaArmeniaArubaAustraliaAustriaAzerbaijanBahamas, TheBahrainBangladeshBarbadosBelarusBelgiumBelizeBeninBermudaBhutanBoliviaBosnia and HerzegovinaBotswanaBrazilBrunei DarussalamBulgariaBurkina FasoBurundiCabo VerdeCambodiaCameroonCanadaCaribbean small statesCayman IslandsCentral African RepublicCentral Europe and the BalticsChadChileChinaColombiaComorosCongo, Dem. Rep.Congo, Rep.Costa RicaCote d'IvoireCroatiaCubaCyprusCzech RepublicDenmarkDjiboutiDominicaDominican RepublicEarly-demographic dividendEast Asia & PacificEast Asia & Pacific (excluding high income)East Asia & Pacific (IDA & IBRD countries)EcuadorEgypt, Arab Rep.El SalvadorEquatorial GuineaEritreaEstoniaEthiopiaEuro areaEurope & Central AsiaEurope & Central Asia (excluding high income)Europe & Central Asia (IDA & IBRD countries)European UnionFaroe IslandsFijiFinlandFragile and conflict affected situationsFranceFrench PolynesiaGabonGambia, TheGeorgiaGermanyGhanaGreeceGreenlandGrenadaGuatemalaGuineaGuinea-BissauGuyanaHaitiHeavily indebted poor countries (HIPC)High incomeHondurasHong Kong SAR, ChinaHungaryIBRD onlyIcelandIDA & IBRD totalIDA blendIDA onlyIDA totalIndiaIndonesiaIran, Islamic Rep.IraqIrelandIsraelItalyJamaicaJapanJordanKazakhstanKenyaKiribatiKorea, Rep.KuwaitKyrgyz RepublicLao PDRLate-demographic dividendLatin America & Caribbean Latin America & Caribbean (excluding high income)Latin America & the Caribbean (IDA & IBRD countries)LatviaLeast developed countries: UN classificationLebanonLesothoLiberiaLibyaLithuaniaLow & middle incomeLower middle incomeLuxembourgMacao SAR, ChinaMacedonia, FYRMadagascarMalawiMalaysiaMaldivesMaliMaltaMauritaniaMauritiusMexicoMiddle East & North AfricaMiddle East & North Africa (excluding high income)Middle East & North Africa (IDA & IBRD countries)Middle incomeMoldovaMongoliaMoroccoMozambiqueMyanmarNamibiaNepalNetherlandsNew CaledoniaNew ZealandNicaraguaNigerNigeriaNorth AmericaNorwayOECD membersOmanOther small statesPacific island small statesPakistanPalauPanamaPapua New GuineaParaguayPeruPhilippinesPolandPortugalPost-demographic dividendPre-demographic dividendQatarRomaniaRussian FederationRwandaSamoaSao Tome and PrincipeSaudi ArabiaSenegalSerbiaSeychellesSierra LeoneSingaporeSlovak RepublicSloveniaSmall statesSolomon IslandsSomaliaSouth AfricaSouth AsiaSouth Asia (IDA & IBRD)SpainSri LankaSt. Kitts and NevisSt. LuciaSt. Vincent and the GrenadinesSub-Saharan Africa Sub-Saharan Africa (excluding high income)Sub-Saharan Africa (IDA & IBRD countries)SudanSurinameSwazilandSwedenSwitzerlandSyrian Arab RepublicTajikistanTanzaniaThailandTimor-LesteTogoTongaTrinidad and TobagoTunisiaTurkeyTurkmenistanTurks and Caicos IslandsTuvaluUgandaUkraineUnited Arab EmiratesUnited KingdomUnited StatesUpper middle incomeUruguayVanuatuVenezuela, RBVietnamVirgin Islands (U.S.)WorldYemen, Rep.ZambiaZimbabwe Timeline:
This timeline shows a graph from 1985 to 2016 of IDA & IBRD total. No data until 1984. Number of actual observations by date: 32.
Source name:
World Development Indicators
Source organization:
World Bank staff estimates from the Comtrade database maintained by the United Nations Statistics Division.
Categories, topics:
Energy & Mining, Private Sector, Trade
Last updated:
apr 23, 2017
Indicators value changes by year
Maximum:
29.772
jan 1, 1986
At the date of observation
Value
Absolute change
Change from previous value
jan 1, 1985
28.709
+28.709
0.0%
jan 1, 1986
29.772
+1.063
3.7%
jan 1, 1987
19.56
-10.212
-34.3%
jan 1, 1988
19.604
+0.044
0.23%
jan 1, 1989
15.29
-4.314
-22.01%
jan 1, 1990
14.863
-0.426
-2.79%
jan 1, 1991
15.806
+0.943
6.34%
jan 1, 1992
16.517
+0.711
4.5%
jan 1, 1993
10.897
-5.62
-34.03%
jan 1, 1994
9.984
-0.913
-8.38%
jan 1, 1995
8.836
-1.148
-11.5%
jan 1, 1996
9.108
+0.272
3.08%
jan 1, 1997
14.54
+5.432
59.64%
jan 1, 1998
16.698
+2.157
14.84%
jan 1, 1999
14.823
-1.875
-11.23%
jan 1, 2000
15.2
+0.377
2.54%
jan 1, 2001
18.515
+3.315
21.81%
jan 1, 2002
18.282
-0.233
-1.26%
jan 1, 2003
17.793
-0.489
-2.67%
jan 1, 2004
17.674
-0.119
-0.67%
jan 1, 2005
17.571
-0.103
-0.58%
jan 1, 2006
19.203
+1.631
9.28%
jan 1, 2007
20.915
+1.712
8.92%
jan 1, 2008
19.654
-1.261
-6.03%
jan 1, 2009
21.392
+1.738
8.84%
jan 1, 2010
21.026
-0.366
-1.71%
jan 1, 2011
22.171
+1.144
5.44%
jan 1, 2012
21.729
-0.441
-1.99%
jan 1, 2013
21.339
-0.39
-1.8%
jan 1, 2014
21.152
-0.187
-0.88%
jan 1, 2015
19.527
-1.625
-7.68%
jan 1, 2016
15.327
-4.201
-21.51%
Ranking of countries by current statistics by years


Comments: