29
/
en
AIzaSyAYiBZKx7MnpbEhh9jyipgxe19OcubqV5w
April 1, 2024
169898
Korea, Rep.
KOR
true
2
1
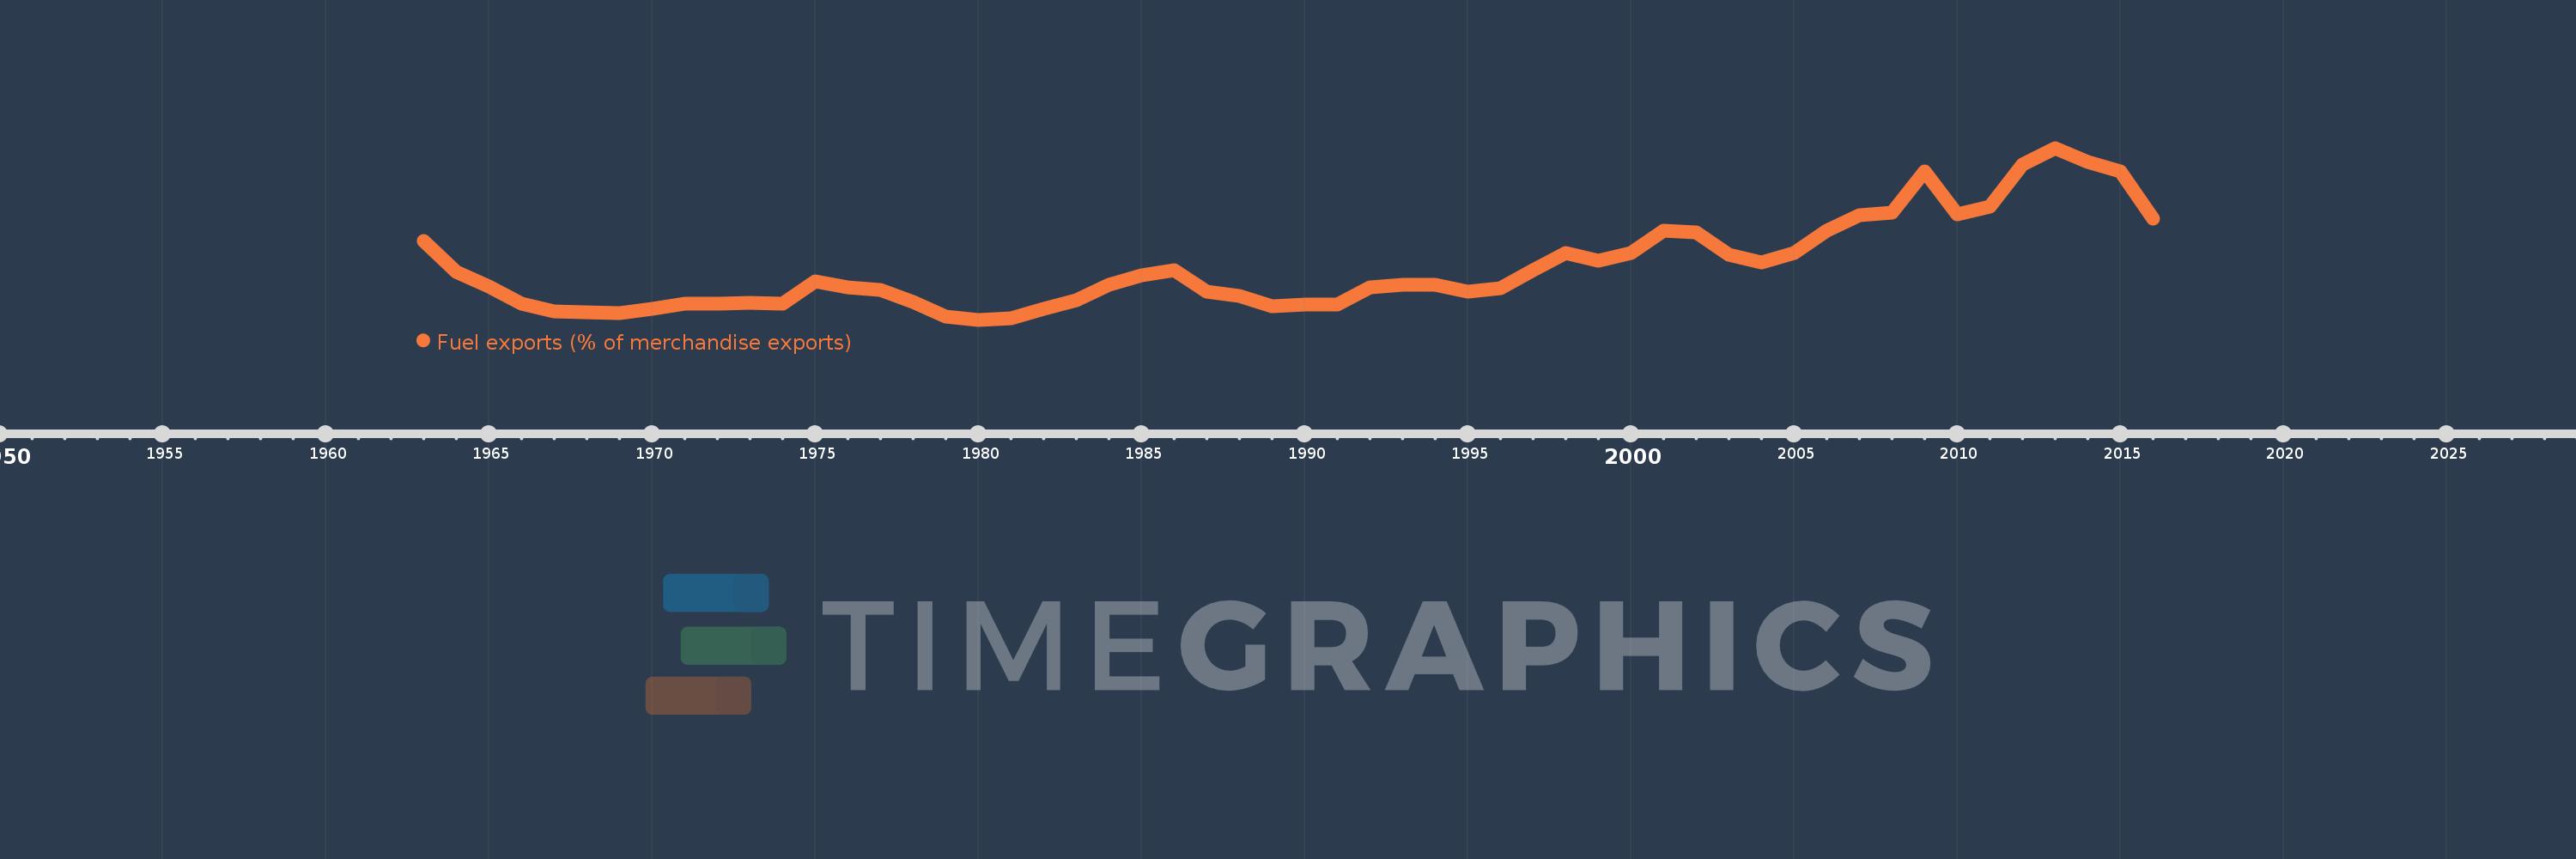
Fuel exports (% of merchandise exports)
2016,2015,2014,2013,2012,2011,2010,2009,2008,2007,2006,2005,2004,2003,2002,2001,2000,1999,1998,1997,1996,1995,1994,1993,1992,1991,1990,1989,1988,1987,1986,1985,1984,1983,1982,1981,1980,1979,1978,1977,1976,1975,1974,1973,1972,1971,1970,1969,1968,1967,1966,1965,1964,1963
This statistics in other country:
AfghanistanAlbaniaAlgeriaAndorraAngolaAntigua and BarbudaArab WorldArgentinaArmeniaArubaAustraliaAustriaAzerbaijanBahamas, TheBahrainBangladeshBarbadosBelarusBelgiumBelizeBeninBermudaBhutanBoliviaBosnia and HerzegovinaBotswanaBrazilBrunei DarussalamBulgariaBurkina FasoBurundiCabo VerdeCambodiaCameroonCanadaCaribbean small statesCayman IslandsCentral African RepublicCentral Europe and the BalticsChadChileChinaColombiaComorosCongo, Dem. Rep.Congo, Rep.Costa RicaCote d'IvoireCroatiaCubaCyprusCzech RepublicDenmarkDjiboutiDominicaDominican RepublicEarly-demographic dividendEast Asia & PacificEast Asia & Pacific (excluding high income)East Asia & Pacific (IDA & IBRD countries)EcuadorEgypt, Arab Rep.El SalvadorEquatorial GuineaEritreaEstoniaEthiopiaEuro areaEurope & Central AsiaEurope & Central Asia (excluding high income)Europe & Central Asia (IDA & IBRD countries)European UnionFaroe IslandsFijiFinlandFragile and conflict affected situationsFranceFrench PolynesiaGabonGambia, TheGeorgiaGermanyGhanaGreeceGreenlandGrenadaGuatemalaGuineaGuinea-BissauGuyanaHaitiHeavily indebted poor countries (HIPC)High incomeHondurasHong Kong SAR, ChinaHungaryIBRD onlyIcelandIDA & IBRD totalIDA blendIDA onlyIDA totalIndiaIndonesiaIran, Islamic Rep.IraqIrelandIsraelItalyJamaicaJapanJordanKazakhstanKenyaKiribatiKorea, Rep.KuwaitKyrgyz RepublicLao PDRLate-demographic dividendLatin America & Caribbean Latin America & Caribbean (excluding high income)Latin America & the Caribbean (IDA & IBRD countries)LatviaLeast developed countries: UN classificationLebanonLesothoLiberiaLibyaLithuaniaLow & middle incomeLower middle incomeLuxembourgMacao SAR, ChinaMacedonia, FYRMadagascarMalawiMalaysiaMaldivesMaliMaltaMauritaniaMauritiusMexicoMiddle East & North AfricaMiddle East & North Africa (excluding high income)Middle East & North Africa (IDA & IBRD countries)Middle incomeMoldovaMongoliaMoroccoMozambiqueMyanmarNamibiaNepalNetherlandsNew CaledoniaNew ZealandNicaraguaNigerNigeriaNorth AmericaNorwayOECD membersOmanOther small statesPacific island small statesPakistanPalauPanamaPapua New GuineaParaguayPeruPhilippinesPolandPortugalPost-demographic dividendPre-demographic dividendQatarRomaniaRussian FederationRwandaSamoaSao Tome and PrincipeSaudi ArabiaSenegalSerbiaSeychellesSierra LeoneSingaporeSlovak RepublicSloveniaSmall statesSolomon IslandsSomaliaSouth AfricaSouth AsiaSouth Asia (IDA & IBRD)SpainSri LankaSt. Kitts and NevisSt. LuciaSt. Vincent and the GrenadinesSub-Saharan Africa Sub-Saharan Africa (excluding high income)Sub-Saharan Africa (IDA & IBRD countries)SudanSurinameSwazilandSwedenSwitzerlandSyrian Arab RepublicTajikistanTanzaniaThailandTimor-LesteTogoTongaTrinidad and TobagoTunisiaTurkeyTurkmenistanTurks and Caicos IslandsTuvaluUgandaUkraineUnited Arab EmiratesUnited KingdomUnited StatesUpper middle incomeUruguayVanuatuVenezuela, RBVietnamVirgin Islands (U.S.)WorldYemen, Rep.ZambiaZimbabwe Timeline:
This timeline shows a graph from 1963 to 2016 of Korea, Rep.. No data until 1962. Number of actual observations by date: 54.
Source name:
World Development Indicators
Source organization:
World Bank staff estimates from the Comtrade database maintained by the United Nations Statistics Division.
Categories, topics:
Energy & Mining, Private Sector, Trade
Last updated:
apr 23, 2017
Indicators value changes by year
At the date of observation
Value
Absolute change
Change from previous value
jan 1, 1963
4.854
+4.854
0.0%
jan 1, 1964
2.976
-1.879
-38.7%
jan 1, 1965
2.097
-0.879
-29.52%
jan 1, 1966
1.084
-1.013
-48.3%
jan 1, 1967
0.603
-0.481
-44.36%
jan 1, 1968
0.553
-0.05
-8.27%
jan 1, 1969
0.505
-0.049
-8.83%
jan 1, 1970
0.784
+0.28
55.4%
jan 1, 1971
1.056
+0.272
34.68%
jan 1, 1972
1.064
+0.008
0.75%
jan 1, 1973
1.125
+0.061
5.72%
jan 1, 1974
1.102
-0.023
-2.03%
jan 1, 1975
2.42
+1.318
119.58%
jan 1, 1976
2.054
-0.365
-15.1%
jan 1, 1977
1.88
-0.174
-8.49%
jan 1, 1978
1.17
-0.71
-37.78%
jan 1, 1979
0.321
-0.849
-72.55%
jan 1, 1980
0.121
-0.2
-62.34%
jan 1, 1981
0.191
+0.07
57.65%
jan 1, 1982
0.749
+0.559
293.09%
jan 1, 1983
1.307
+0.557
74.4%
jan 1, 1984
2.194
+0.888
67.94%
jan 1, 1985
2.751
+0.557
25.38%
jan 1, 1986
3.068
+0.317
11.51%
jan 1, 1987
1.781
-1.287
-41.95%
jan 1, 1988
1.526
-0.255
-14.32%
jan 1, 1989
0.925
-0.601
-39.4%
jan 1, 1990
1.047
+0.122
13.24%
jan 1, 1991
1.011
-0.036
-3.44%
jan 1, 1992
2.052
+1.041
102.96%
jan 1, 1993
2.205
+0.153
7.47%
jan 1, 1994
2.21
+0.005
0.22%
jan 1, 1995
1.792
-0.418
-18.91%
jan 1, 1996
1.982
+0.19
10.61%
jan 1, 1997
3.102
+1.119
56.46%
jan 1, 1998
4.111
+1.009
32.53%
jan 1, 1999
3.665
-0.446
-10.86%
jan 1, 2000
4.101
+0.436
11.91%
jan 1, 2001
5.465
+1.364
33.25%
jan 1, 2002
5.338
-0.127
-2.32%
jan 1, 2003
4.024
-1.314
-24.61%
jan 1, 2004
3.539
-0.486
-12.07%
jan 1, 2005
4.121
+0.582
16.46%
jan 1, 2006
5.463
+1.341
32.55%
jan 1, 2007
6.347
+0.884
16.19%
jan 1, 2008
6.531
+0.184
2.89%
jan 1, 2009
8.993
+2.463
37.71%
jan 1, 2010
6.43
-2.563
-28.5%
jan 1, 2011
6.876
+0.446
6.94%
jan 1, 2012
9.42
+2.544
37.0%
jan 1, 2013
10.39
+0.97
10.3%
jan 1, 2014
9.54
-0.851
-8.19%
jan 1, 2015
9.008
-0.532
-5.57%
jan 1, 2016
6.168
-2.84
-31.53%
Ranking of countries by current statistics by years


Comments: