29
/
en
AIzaSyAYiBZKx7MnpbEhh9jyipgxe19OcubqV5w
April 1, 2024
163746
Japan
JPN
true
2
1
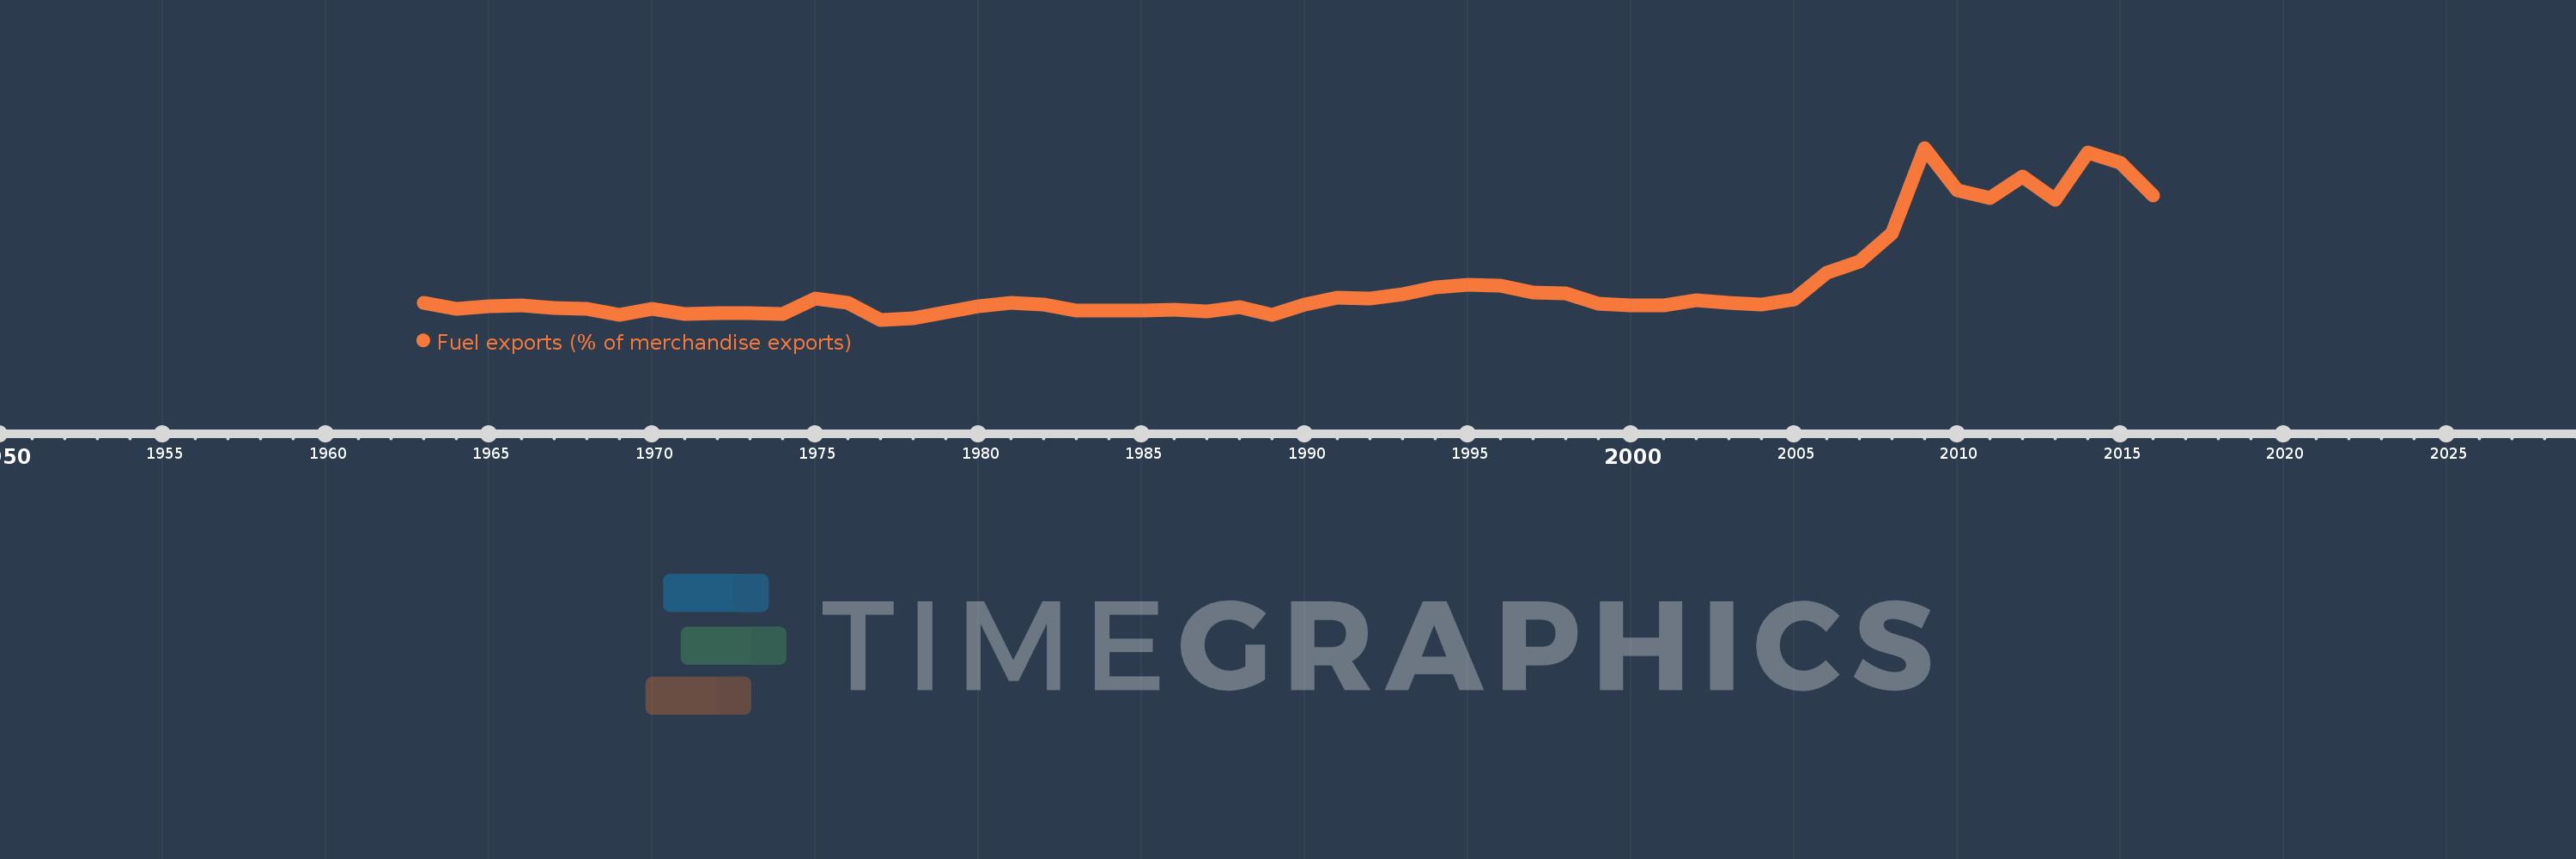
Fuel exports (% of merchandise exports)
2016,2015,2014,2013,2012,2011,2010,2009,2008,2007,2006,2005,2004,2003,2002,2001,2000,1999,1998,1997,1996,1995,1994,1993,1992,1991,1990,1989,1988,1987,1986,1985,1984,1983,1982,1981,1980,1979,1978,1977,1976,1975,1974,1973,1972,1971,1970,1969,1968,1967,1966,1965,1964,1963
This statistics in other country:
AfghanistanAlbaniaAlgeriaAndorraAngolaAntigua and BarbudaArab WorldArgentinaArmeniaArubaAustraliaAustriaAzerbaijanBahamas, TheBahrainBangladeshBarbadosBelarusBelgiumBelizeBeninBermudaBhutanBoliviaBosnia and HerzegovinaBotswanaBrazilBrunei DarussalamBulgariaBurkina FasoBurundiCabo VerdeCambodiaCameroonCanadaCaribbean small statesCayman IslandsCentral African RepublicCentral Europe and the BalticsChadChileChinaColombiaComorosCongo, Dem. Rep.Congo, Rep.Costa RicaCote d'IvoireCroatiaCubaCyprusCzech RepublicDenmarkDjiboutiDominicaDominican RepublicEarly-demographic dividendEast Asia & PacificEast Asia & Pacific (excluding high income)East Asia & Pacific (IDA & IBRD countries)EcuadorEgypt, Arab Rep.El SalvadorEquatorial GuineaEritreaEstoniaEthiopiaEuro areaEurope & Central AsiaEurope & Central Asia (excluding high income)Europe & Central Asia (IDA & IBRD countries)European UnionFaroe IslandsFijiFinlandFragile and conflict affected situationsFranceFrench PolynesiaGabonGambia, TheGeorgiaGermanyGhanaGreeceGreenlandGrenadaGuatemalaGuineaGuinea-BissauGuyanaHaitiHeavily indebted poor countries (HIPC)High incomeHondurasHong Kong SAR, ChinaHungaryIBRD onlyIcelandIDA & IBRD totalIDA blendIDA onlyIDA totalIndiaIndonesiaIran, Islamic Rep.IraqIrelandIsraelItalyJamaicaJapanJordanKazakhstanKenyaKiribatiKorea, Rep.KuwaitKyrgyz RepublicLao PDRLate-demographic dividendLatin America & Caribbean Latin America & Caribbean (excluding high income)Latin America & the Caribbean (IDA & IBRD countries)LatviaLeast developed countries: UN classificationLebanonLesothoLiberiaLibyaLithuaniaLow & middle incomeLower middle incomeLuxembourgMacao SAR, ChinaMacedonia, FYRMadagascarMalawiMalaysiaMaldivesMaliMaltaMauritaniaMauritiusMexicoMiddle East & North AfricaMiddle East & North Africa (excluding high income)Middle East & North Africa (IDA & IBRD countries)Middle incomeMoldovaMongoliaMoroccoMozambiqueMyanmarNamibiaNepalNetherlandsNew CaledoniaNew ZealandNicaraguaNigerNigeriaNorth AmericaNorwayOECD membersOmanOther small statesPacific island small statesPakistanPalauPanamaPapua New GuineaParaguayPeruPhilippinesPolandPortugalPost-demographic dividendPre-demographic dividendQatarRomaniaRussian FederationRwandaSamoaSao Tome and PrincipeSaudi ArabiaSenegalSerbiaSeychellesSierra LeoneSingaporeSlovak RepublicSloveniaSmall statesSolomon IslandsSomaliaSouth AfricaSouth AsiaSouth Asia (IDA & IBRD)SpainSri LankaSt. Kitts and NevisSt. LuciaSt. Vincent and the GrenadinesSub-Saharan Africa Sub-Saharan Africa (excluding high income)Sub-Saharan Africa (IDA & IBRD countries)SudanSurinameSwazilandSwedenSwitzerlandSyrian Arab RepublicTajikistanTanzaniaThailandTimor-LesteTogoTongaTrinidad and TobagoTunisiaTurkeyTurkmenistanTurks and Caicos IslandsTuvaluUgandaUkraineUnited Arab EmiratesUnited KingdomUnited StatesUpper middle incomeUruguayVanuatuVenezuela, RBVietnamVirgin Islands (U.S.)WorldYemen, Rep.ZambiaZimbabwe Timeline:
This timeline shows a graph from 1963 to 2016 of Japan. No data until 1962. Number of actual observations by date: 54.
Source name:
World Development Indicators
Source organization:
World Bank staff estimates from the Comtrade database maintained by the United Nations Statistics Division.
Categories, topics:
Energy & Mining, Private Sector, Trade
Last updated:
apr 23, 2017
Indicators value changes by year
At the date of observation
Value
Absolute change
Change from previous value
jan 1, 1963
0.397
+0.397
0.0%
jan 1, 1964
0.312
-0.084
-21.2%
jan 1, 1965
0.353
+0.041
12.99%
jan 1, 1966
0.355
+0.002
0.65%
jan 1, 1967
0.324
-0.031
-8.74%
jan 1, 1968
0.316
-0.008
-2.44%
jan 1, 1969
0.241
-0.075
-23.79%
jan 1, 1970
0.312
+0.071
29.61%
jan 1, 1971
0.246
-0.066
-21.21%
jan 1, 1972
0.261
+0.014
5.81%
jan 1, 1973
0.259
-0.002
-0.75%
jan 1, 1974
0.25
-0.008
-3.24%
jan 1, 1975
0.452
+0.202
80.78%
jan 1, 1976
0.394
-0.058
-12.87%
jan 1, 1977
0.175
-0.219
-55.64%
jan 1, 1978
0.193
+0.019
10.64%
jan 1, 1979
0.267
+0.074
38.27%
jan 1, 1980
0.346
+0.078
29.34%
jan 1, 1981
0.389
+0.043
12.4%
jan 1, 1982
0.365
-0.024
-6.25%
jan 1, 1983
0.297
-0.068
-18.59%
jan 1, 1984
0.294
-0.002
-0.78%
jan 1, 1985
0.297
+0.003
0.85%
jan 1, 1986
0.306
+0.01
3.21%
jan 1, 1987
0.281
-0.025
-8.23%
jan 1, 1988
0.342
+0.06
21.41%
jan 1, 1989
0.242
-0.099
-29.12%
jan 1, 1990
0.375
+0.133
54.95%
jan 1, 1991
0.463
+0.088
23.36%
jan 1, 1992
0.443
-0.02
-4.25%
jan 1, 1993
0.505
+0.062
13.96%
jan 1, 1994
0.589
+0.084
16.74%
jan 1, 1995
0.629
+0.039
6.68%
jan 1, 1996
0.608
-0.02
-3.23%
jan 1, 1997
0.523
-0.086
-14.1%
jan 1, 1998
0.517
-0.005
-1.05%
jan 1, 1999
0.381
-0.136
-26.37%
jan 1, 2000
0.358
-0.023
-6.0%
jan 1, 2001
0.363
+0.005
1.48%
jan 1, 2002
0.423
+0.06
16.41%
jan 1, 2003
0.392
-0.031
-7.23%
jan 1, 2004
0.374
-0.018
-4.61%
jan 1, 2005
0.44
+0.066
17.65%
jan 1, 2006
0.777
+0.337
76.59%
jan 1, 2007
0.919
+0.141
18.19%
jan 1, 2008
1.29
+0.371
40.36%
jan 1, 2009
2.384
+1.094
84.86%
jan 1, 2010
1.844
-0.539
-22.63%
jan 1, 2011
1.737
-0.107
-5.81%
jan 1, 2012
2.015
+0.278
16.0%
jan 1, 2013
1.715
-0.3
-14.91%
jan 1, 2014
2.32
+0.606
35.31%
jan 1, 2015
2.198
-0.122
-5.26%
jan 1, 2016
1.771
-0.427
-19.41%
Ranking of countries by current statistics by years


Comments: