29
/
en
AIzaSyAYiBZKx7MnpbEhh9jyipgxe19OcubqV5w
April 1, 2024
190227
Mali
MLI
true
2
1
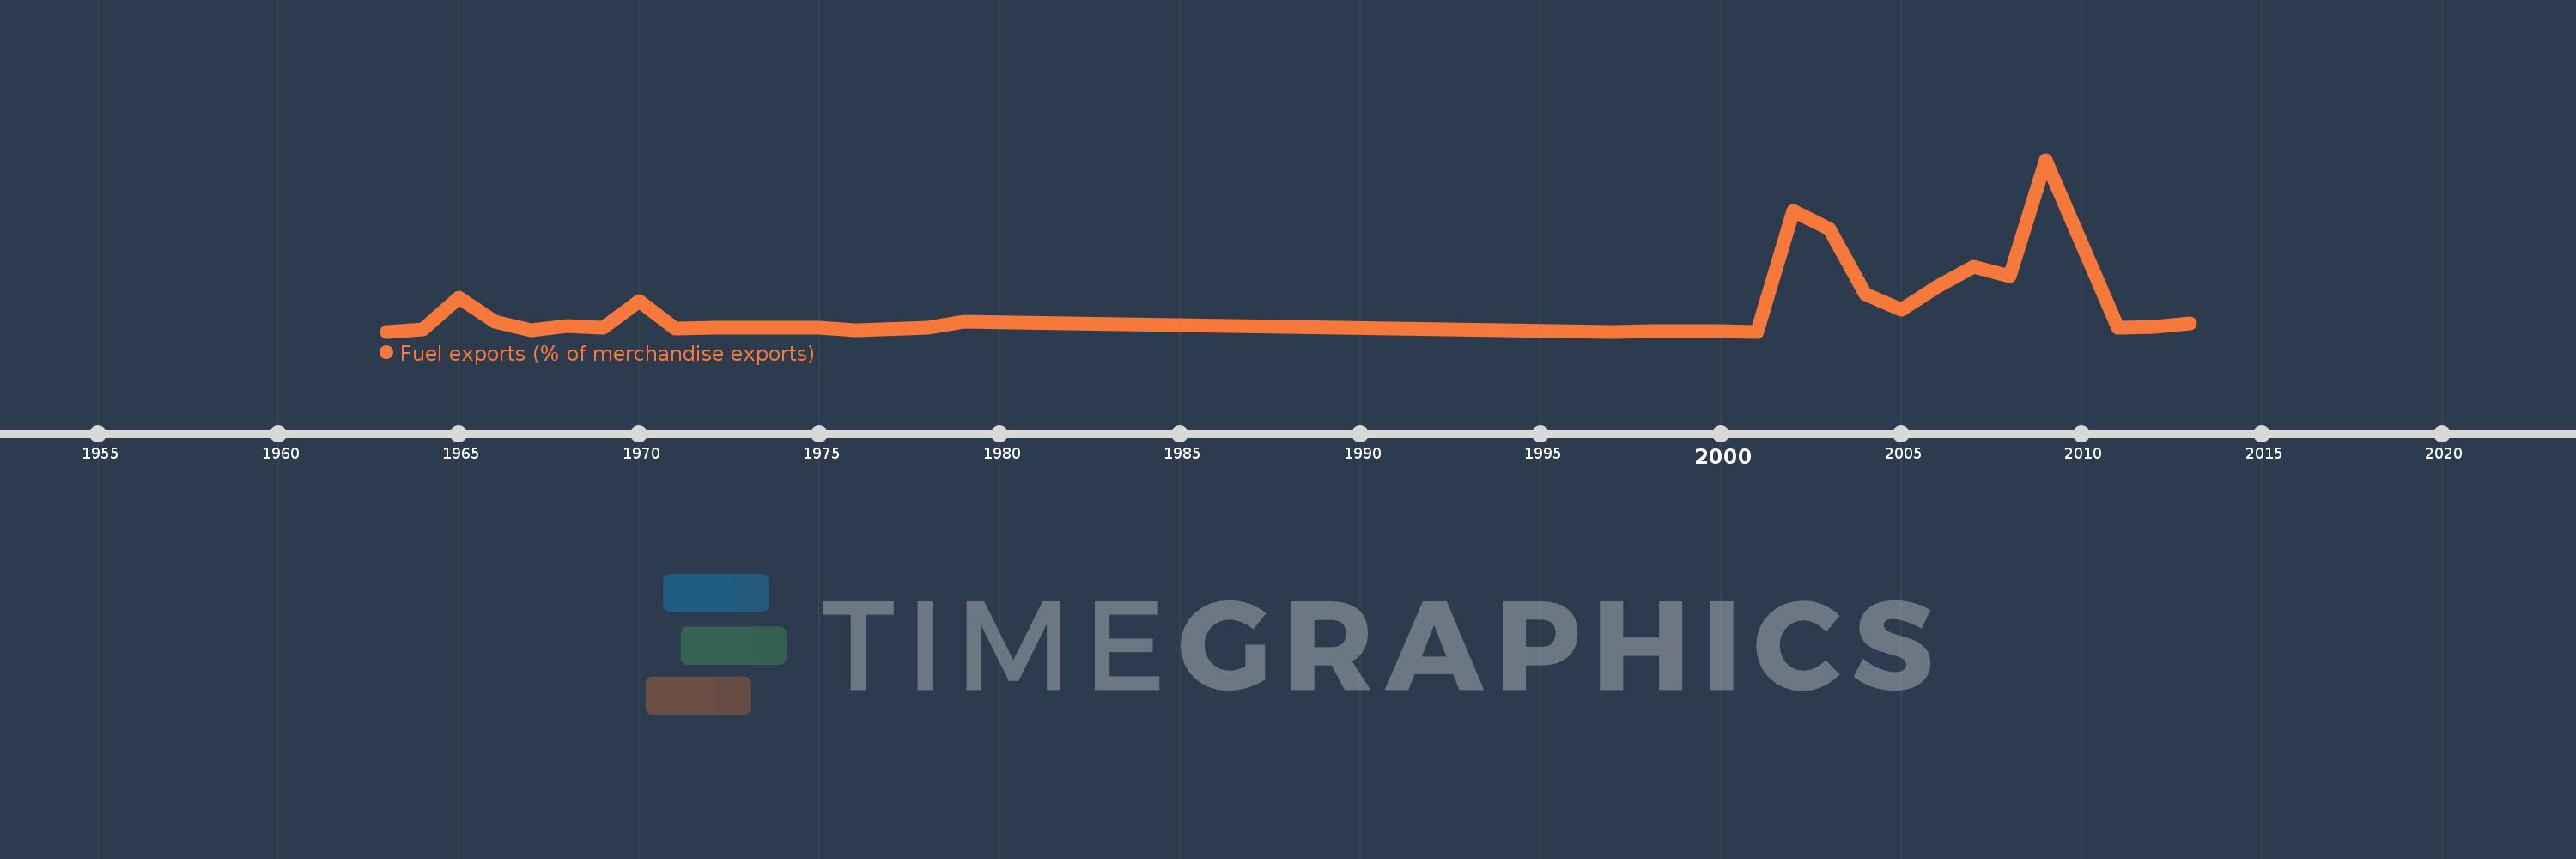
Fuel exports (% of merchandise exports)
2013,2012,2011,2009,2008,2007,2006,2005,2004,2003,2002,2001,2000,1999,1998,1997,1979,1978,1976,1975,1972,1971,1970,1969,1968,1967,1966,1965,1964,1963
This statistics in other country:
AfghanistanAlbaniaAlgeriaAndorraAngolaAntigua and BarbudaArab WorldArgentinaArmeniaArubaAustraliaAustriaAzerbaijanBahamas, TheBahrainBangladeshBarbadosBelarusBelgiumBelizeBeninBermudaBhutanBoliviaBosnia and HerzegovinaBotswanaBrazilBrunei DarussalamBulgariaBurkina FasoBurundiCabo VerdeCambodiaCameroonCanadaCaribbean small statesCayman IslandsCentral African RepublicCentral Europe and the BalticsChadChileChinaColombiaComorosCongo, Dem. Rep.Congo, Rep.Costa RicaCote d'IvoireCroatiaCubaCyprusCzech RepublicDenmarkDjiboutiDominicaDominican RepublicEarly-demographic dividendEast Asia & PacificEast Asia & Pacific (excluding high income)East Asia & Pacific (IDA & IBRD countries)EcuadorEgypt, Arab Rep.El SalvadorEquatorial GuineaEritreaEstoniaEthiopiaEuro areaEurope & Central AsiaEurope & Central Asia (excluding high income)Europe & Central Asia (IDA & IBRD countries)European UnionFaroe IslandsFijiFinlandFragile and conflict affected situationsFranceFrench PolynesiaGabonGambia, TheGeorgiaGermanyGhanaGreeceGreenlandGrenadaGuatemalaGuineaGuinea-BissauGuyanaHaitiHeavily indebted poor countries (HIPC)High incomeHondurasHong Kong SAR, ChinaHungaryIBRD onlyIcelandIDA & IBRD totalIDA blendIDA onlyIDA totalIndiaIndonesiaIran, Islamic Rep.IraqIrelandIsraelItalyJamaicaJapanJordanKazakhstanKenyaKiribatiKorea, Rep.KuwaitKyrgyz RepublicLao PDRLate-demographic dividendLatin America & Caribbean Latin America & Caribbean (excluding high income)Latin America & the Caribbean (IDA & IBRD countries)LatviaLeast developed countries: UN classificationLebanonLesothoLiberiaLibyaLithuaniaLow & middle incomeLower middle incomeLuxembourgMacao SAR, ChinaMacedonia, FYRMadagascarMalawiMalaysiaMaldivesMaliMaltaMauritaniaMauritiusMexicoMiddle East & North AfricaMiddle East & North Africa (excluding high income)Middle East & North Africa (IDA & IBRD countries)Middle incomeMoldovaMongoliaMoroccoMozambiqueMyanmarNamibiaNepalNetherlandsNew CaledoniaNew ZealandNicaraguaNigerNigeriaNorth AmericaNorwayOECD membersOmanOther small statesPacific island small statesPakistanPalauPanamaPapua New GuineaParaguayPeruPhilippinesPolandPortugalPost-demographic dividendPre-demographic dividendQatarRomaniaRussian FederationRwandaSamoaSao Tome and PrincipeSaudi ArabiaSenegalSerbiaSeychellesSierra LeoneSingaporeSlovak RepublicSloveniaSmall statesSolomon IslandsSomaliaSouth AfricaSouth AsiaSouth Asia (IDA & IBRD)SpainSri LankaSt. Kitts and NevisSt. LuciaSt. Vincent and the GrenadinesSub-Saharan Africa Sub-Saharan Africa (excluding high income)Sub-Saharan Africa (IDA & IBRD countries)SudanSurinameSwazilandSwedenSwitzerlandSyrian Arab RepublicTajikistanTanzaniaThailandTimor-LesteTogoTongaTrinidad and TobagoTunisiaTurkeyTurkmenistanTurks and Caicos IslandsTuvaluUgandaUkraineUnited Arab EmiratesUnited KingdomUnited StatesUpper middle incomeUruguayVanuatuVenezuela, RBVietnamVirgin Islands (U.S.)WorldYemen, Rep.ZambiaZimbabwe Timeline:
This timeline shows a graph from 1963 to 2013 of Mali. No data until 1962. Number of actual observations by date: 30.
Source name:
World Development Indicators
Source organization:
World Bank staff estimates from the Comtrade database maintained by the United Nations Statistics Division.
Categories, topics:
Energy & Mining, Private Sector, Trade
Last updated:
apr 23, 2017
Indicators value changes by year
At the date of observation
Value
Absolute change
Change from previous value
jan 1, 1964
0.06
+0.06
60.48K%
jan 1, 1965
1.187
+1.126
1.86K%
jan 1, 1966
0.351
-0.836
-70.44%
jan 1, 1967
0.036
-0.315
-89.67%
jan 1, 1968
0.186
+0.15
412.79%
jan 1, 1969
0.143
-0.043
-23.19%
jan 1, 1970
1.056
+0.913
640.0%
jan 1, 1971
0.091
-0.966
-91.43%
jan 1, 1972
0.132
+0.041
45.71%
jan 1, 1975
0.129
-0.003
-2.16%
jan 1, 1976
0.05
-0.079
-61.24%
jan 1, 1978
0.142
+0.092
184.47%
jan 1, 1979
0.358
+0.216
151.9%
jan 1, 1997
0.0
-0.358
-100.0%
jan 1, 1998
0.003
+0.003
%
jan 1, 1999
0.027
+0.024
877.73%
jan 1, 2000
0.005
-0.021
-80.5%
jan 1, 2001
0.0
-0.005
-98.62%
jan 1, 2002
4.217
+4.217
5.86 mln%
jan 1, 2003
3.58
-0.638
-15.12%
jan 1, 2004
1.3
-2.279
-63.68%
jan 1, 2005
0.768
-0.533
-40.97%
jan 1, 2006
1.573
+0.806
104.98%
jan 1, 2007
2.254
+0.681
43.25%
jan 1, 2008
1.917
-0.337
-14.94%
jan 1, 2009
5.988
+4.071
212.38%
jan 1, 2011
0.127
-5.861
-97.88%
jan 1, 2012
0.155
+0.028
21.62%
jan 1, 2013
0.295
+0.141
90.95%
Ranking of countries by current statistics by years


Comments: