29
/
en
AIzaSyAYiBZKx7MnpbEhh9jyipgxe19OcubqV5w
April 1, 2024
275679
United Kingdom
GBR
true
2
1
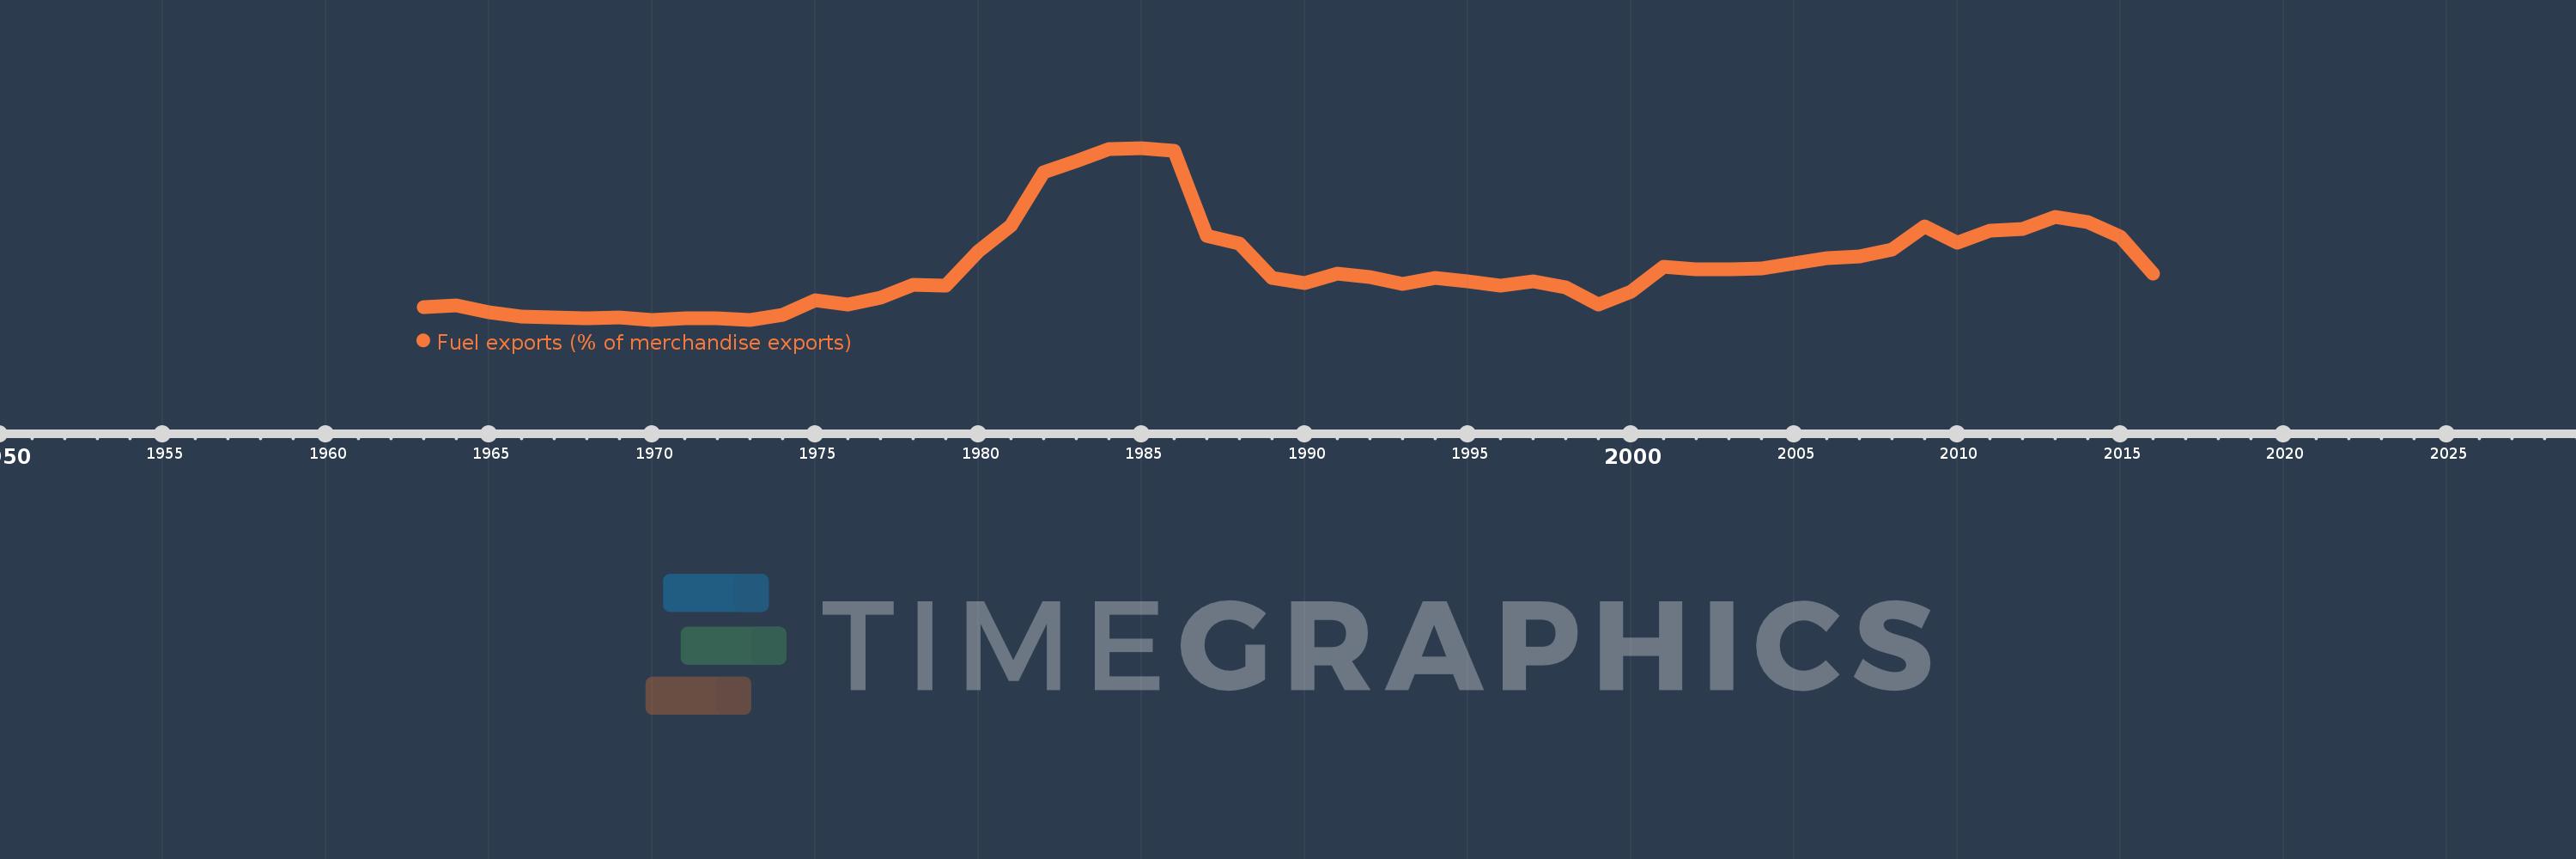
Fuel exports (% of merchandise exports)
2016,2015,2014,2013,2012,2011,2010,2009,2008,2007,2006,2005,2004,2003,2002,2001,2000,1999,1998,1997,1996,1995,1994,1993,1992,1991,1990,1989,1988,1987,1986,1985,1984,1983,1982,1981,1980,1979,1978,1977,1976,1975,1974,1973,1972,1971,1970,1969,1968,1967,1966,1965,1964,1963
This statistics in other country:
AfghanistanAlbaniaAlgeriaAndorraAngolaAntigua and BarbudaArab WorldArgentinaArmeniaArubaAustraliaAustriaAzerbaijanBahamas, TheBahrainBangladeshBarbadosBelarusBelgiumBelizeBeninBermudaBhutanBoliviaBosnia and HerzegovinaBotswanaBrazilBrunei DarussalamBulgariaBurkina FasoBurundiCabo VerdeCambodiaCameroonCanadaCaribbean small statesCayman IslandsCentral African RepublicCentral Europe and the BalticsChadChileChinaColombiaComorosCongo, Dem. Rep.Congo, Rep.Costa RicaCote d'IvoireCroatiaCubaCyprusCzech RepublicDenmarkDjiboutiDominicaDominican RepublicEarly-demographic dividendEast Asia & PacificEast Asia & Pacific (excluding high income)East Asia & Pacific (IDA & IBRD countries)EcuadorEgypt, Arab Rep.El SalvadorEquatorial GuineaEritreaEstoniaEthiopiaEuro areaEurope & Central AsiaEurope & Central Asia (excluding high income)Europe & Central Asia (IDA & IBRD countries)European UnionFaroe IslandsFijiFinlandFragile and conflict affected situationsFranceFrench PolynesiaGabonGambia, TheGeorgiaGermanyGhanaGreeceGreenlandGrenadaGuatemalaGuineaGuinea-BissauGuyanaHaitiHeavily indebted poor countries (HIPC)High incomeHondurasHong Kong SAR, ChinaHungaryIBRD onlyIcelandIDA & IBRD totalIDA blendIDA onlyIDA totalIndiaIndonesiaIran, Islamic Rep.IraqIrelandIsraelItalyJamaicaJapanJordanKazakhstanKenyaKiribatiKorea, Rep.KuwaitKyrgyz RepublicLao PDRLate-demographic dividendLatin America & Caribbean Latin America & Caribbean (excluding high income)Latin America & the Caribbean (IDA & IBRD countries)LatviaLeast developed countries: UN classificationLebanonLesothoLiberiaLibyaLithuaniaLow & middle incomeLower middle incomeLuxembourgMacao SAR, ChinaMacedonia, FYRMadagascarMalawiMalaysiaMaldivesMaliMaltaMauritaniaMauritiusMexicoMiddle East & North AfricaMiddle East & North Africa (excluding high income)Middle East & North Africa (IDA & IBRD countries)Middle incomeMoldovaMongoliaMoroccoMozambiqueMyanmarNamibiaNepalNetherlandsNew CaledoniaNew ZealandNicaraguaNigerNigeriaNorth AmericaNorwayOECD membersOmanOther small statesPacific island small statesPakistanPalauPanamaPapua New GuineaParaguayPeruPhilippinesPolandPortugalPost-demographic dividendPre-demographic dividendQatarRomaniaRussian FederationRwandaSamoaSao Tome and PrincipeSaudi ArabiaSenegalSerbiaSeychellesSierra LeoneSingaporeSlovak RepublicSloveniaSmall statesSolomon IslandsSomaliaSouth AfricaSouth AsiaSouth Asia (IDA & IBRD)SpainSri LankaSt. Kitts and NevisSt. LuciaSt. Vincent and the GrenadinesSub-Saharan Africa Sub-Saharan Africa (excluding high income)Sub-Saharan Africa (IDA & IBRD countries)SudanSurinameSwazilandSwedenSwitzerlandSyrian Arab RepublicTajikistanTanzaniaThailandTimor-LesteTogoTongaTrinidad and TobagoTunisiaTurkeyTurkmenistanTurks and Caicos IslandsTuvaluUgandaUkraineUnited Arab EmiratesUnited KingdomUnited StatesUpper middle incomeUruguayVanuatuVenezuela, RBVietnamVirgin Islands (U.S.)WorldYemen, Rep.ZambiaZimbabwe Timeline:
This timeline shows a graph from 1963 to 2016 of United Kingdom. No data until 1962. Number of actual observations by date: 54.
Source name:
World Development Indicators
Source organization:
World Bank staff estimates from the Comtrade database maintained by the United Nations Statistics Division.
Categories, topics:
Energy & Mining, Private Sector, Trade
Last updated:
apr 23, 2017
Indicators value changes by year
Maximum:
21.716
jan 1, 1985
At the date of observation
Value
Absolute change
Change from previous value
jan 1, 1963
3.856
+3.856
0.0%
jan 1, 1964
4.036
+0.18
4.66%
jan 1, 1965
3.262
-0.774
-19.18%
jan 1, 1966
2.824
-0.437
-13.4%
jan 1, 1967
2.661
-0.163
-5.78%
jan 1, 1968
2.558
-0.103
-3.87%
jan 1, 1969
2.695
+0.137
5.35%
jan 1, 1970
2.435
-0.26
-9.64%
jan 1, 1971
2.566
+0.13
5.35%
jan 1, 1972
2.572
+0.006
0.25%
jan 1, 1973
2.449
-0.123
-4.77%
jan 1, 1974
2.971
+0.521
21.29%
jan 1, 1975
4.652
+1.681
56.59%
jan 1, 1976
4.118
-0.534
-11.47%
jan 1, 1977
4.893
+0.774
18.81%
jan 1, 1978
6.321
+1.429
29.2%
jan 1, 1979
6.286
-0.035
-0.56%
jan 1, 1980
10.107
+3.82
60.77%
jan 1, 1981
13.03
+2.923
28.92%
jan 1, 1982
18.959
+5.93
45.51%
jan 1, 1983
20.288
+1.329
7.01%
jan 1, 1984
21.591
+1.303
6.42%
jan 1, 1985
21.716
+0.124
0.58%
jan 1, 1986
21.435
-0.281
-1.29%
jan 1, 1987
11.874
-9.561
-44.61%
jan 1, 1988
10.955
-0.918
-7.73%
jan 1, 1989
7.146
-3.809
-34.77%
jan 1, 1990
6.598
-0.548
-7.67%
jan 1, 1991
7.605
+1.007
15.26%
jan 1, 1992
7.245
-0.36
-4.73%
jan 1, 1993
6.44
-0.805
-11.11%
jan 1, 1994
7.103
+0.663
10.29%
jan 1, 1995
6.722
-0.381
-5.37%
jan 1, 1996
6.224
-0.498
-7.41%
jan 1, 1997
6.751
+0.527
8.46%
jan 1, 1998
6.059
-0.692
-10.25%
jan 1, 1999
4.173
-1.886
-31.13%
jan 1, 2000
5.569
+1.396
33.46%
jan 1, 2001
8.34
+2.771
49.75%
jan 1, 2002
8.082
-0.258
-3.09%
jan 1, 2003
8.108
+0.026
0.33%
jan 1, 2004
8.198
+0.09
1.1%
jan 1, 2005
8.753
+0.555
6.78%
jan 1, 2006
9.361
+0.608
6.95%
jan 1, 2007
9.509
+0.148
1.58%
jan 1, 2008
10.275
+0.765
8.04%
jan 1, 2009
12.88
+2.605
25.36%
jan 1, 2010
11.044
-1.836
-14.25%
jan 1, 2011
12.438
+1.394
12.62%
jan 1, 2012
12.638
+0.201
1.61%
jan 1, 2013
13.936
+1.298
10.27%
jan 1, 2014
13.368
-0.568
-4.07%
jan 1, 2015
11.763
-1.605
-12.01%
jan 1, 2016
7.655
-4.108
-34.92%
Ranking of countries by current statistics by years


Comments: