29
/
en
AIzaSyAYiBZKx7MnpbEhh9jyipgxe19OcubqV5w
April 1, 2024
51844
North America
NAC
false
2
1
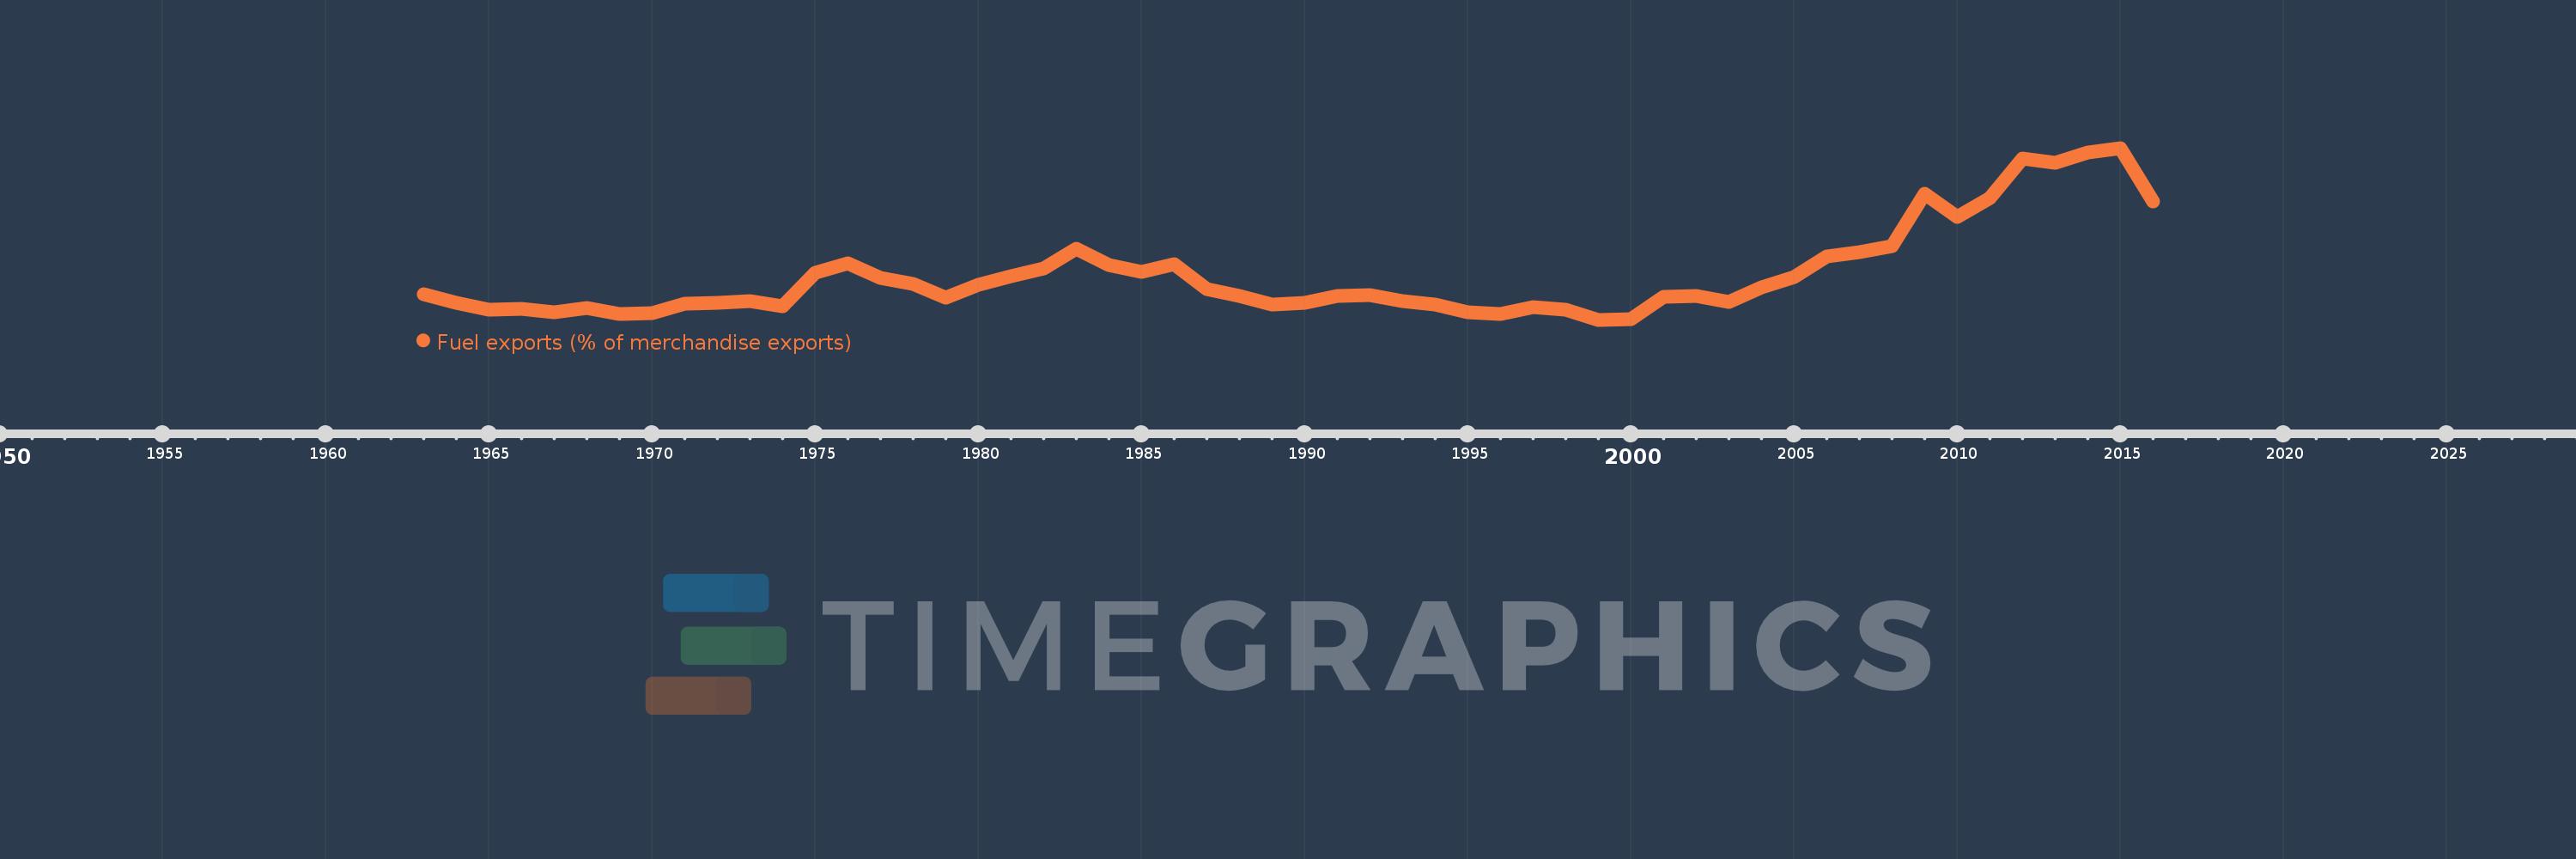
Fuel exports (% of merchandise exports)
2016,2015,2014,2013,2012,2011,2010,2009,2008,2007,2006,2005,2004,2003,2002,2001,2000,1999,1998,1997,1996,1995,1994,1993,1992,1991,1990,1989,1988,1987,1986,1985,1984,1983,1982,1981,1980,1979,1978,1977,1976,1975,1974,1973,1972,1971,1970,1969,1968,1967,1966,1965,1964,1963
This statistics in other country:
AfghanistanAlbaniaAlgeriaAndorraAngolaAntigua and BarbudaArab WorldArgentinaArmeniaArubaAustraliaAustriaAzerbaijanBahamas, TheBahrainBangladeshBarbadosBelarusBelgiumBelizeBeninBermudaBhutanBoliviaBosnia and HerzegovinaBotswanaBrazilBrunei DarussalamBulgariaBurkina FasoBurundiCabo VerdeCambodiaCameroonCanadaCaribbean small statesCayman IslandsCentral African RepublicCentral Europe and the BalticsChadChileChinaColombiaComorosCongo, Dem. Rep.Congo, Rep.Costa RicaCote d'IvoireCroatiaCubaCyprusCzech RepublicDenmarkDjiboutiDominicaDominican RepublicEarly-demographic dividendEast Asia & PacificEast Asia & Pacific (excluding high income)East Asia & Pacific (IDA & IBRD countries)EcuadorEgypt, Arab Rep.El SalvadorEquatorial GuineaEritreaEstoniaEthiopiaEuro areaEurope & Central AsiaEurope & Central Asia (excluding high income)Europe & Central Asia (IDA & IBRD countries)European UnionFaroe IslandsFijiFinlandFragile and conflict affected situationsFranceFrench PolynesiaGabonGambia, TheGeorgiaGermanyGhanaGreeceGreenlandGrenadaGuatemalaGuineaGuinea-BissauGuyanaHaitiHeavily indebted poor countries (HIPC)High incomeHondurasHong Kong SAR, ChinaHungaryIBRD onlyIcelandIDA & IBRD totalIDA blendIDA onlyIDA totalIndiaIndonesiaIran, Islamic Rep.IraqIrelandIsraelItalyJamaicaJapanJordanKazakhstanKenyaKiribatiKorea, Rep.KuwaitKyrgyz RepublicLao PDRLate-demographic dividendLatin America & Caribbean Latin America & Caribbean (excluding high income)Latin America & the Caribbean (IDA & IBRD countries)LatviaLeast developed countries: UN classificationLebanonLesothoLiberiaLibyaLithuaniaLow & middle incomeLower middle incomeLuxembourgMacao SAR, ChinaMacedonia, FYRMadagascarMalawiMalaysiaMaldivesMaliMaltaMauritaniaMauritiusMexicoMiddle East & North AfricaMiddle East & North Africa (excluding high income)Middle East & North Africa (IDA & IBRD countries)Middle incomeMoldovaMongoliaMoroccoMozambiqueMyanmarNamibiaNepalNetherlandsNew CaledoniaNew ZealandNicaraguaNigerNigeriaNorth AmericaNorwayOECD membersOmanOther small statesPacific island small statesPakistanPalauPanamaPapua New GuineaParaguayPeruPhilippinesPolandPortugalPost-demographic dividendPre-demographic dividendQatarRomaniaRussian FederationRwandaSamoaSao Tome and PrincipeSaudi ArabiaSenegalSerbiaSeychellesSierra LeoneSingaporeSlovak RepublicSloveniaSmall statesSolomon IslandsSomaliaSouth AfricaSouth AsiaSouth Asia (IDA & IBRD)SpainSri LankaSt. Kitts and NevisSt. LuciaSt. Vincent and the GrenadinesSub-Saharan Africa Sub-Saharan Africa (excluding high income)Sub-Saharan Africa (IDA & IBRD countries)SudanSurinameSwazilandSwedenSwitzerlandSyrian Arab RepublicTajikistanTanzaniaThailandTimor-LesteTogoTongaTrinidad and TobagoTunisiaTurkeyTurkmenistanTurks and Caicos IslandsTuvaluUgandaUkraineUnited Arab EmiratesUnited KingdomUnited StatesUpper middle incomeUruguayVanuatuVenezuela, RBVietnamVirgin Islands (U.S.)WorldYemen, Rep.ZambiaZimbabwe Timeline:
This timeline shows a graph from 1963 to 2016 of North America. No data until 1962. Number of actual observations by date: 54.
Source name:
World Development Indicators
Source organization:
World Bank staff estimates from the Comtrade database maintained by the United Nations Statistics Division.
Categories, topics:
Energy & Mining, Private Sector, Trade
Last updated:
apr 23, 2017
Indicators value changes by year
At the date of observation
Value
Absolute change
Change from previous value
jan 1, 1963
4.923
+4.923
0.0%
jan 1, 1964
4.334
-0.589
-11.96%
jan 1, 1965
3.835
-0.499
-11.51%
jan 1, 1966
3.873
+0.038
0.99%
jan 1, 1967
3.634
-0.239
-6.18%
jan 1, 1968
3.951
+0.317
8.71%
jan 1, 1969
3.567
-0.384
-9.71%
jan 1, 1970
3.573
+0.006
0.16%
jan 1, 1971
4.279
+0.707
19.78%
jan 1, 1972
4.302
+0.023
0.54%
jan 1, 1973
4.431
+0.129
2.99%
jan 1, 1974
4.1
-0.331
-7.48%
jan 1, 1975
6.395
+2.295
55.98%
jan 1, 1976
7.074
+0.678
10.61%
jan 1, 1977
6.074
-0.999
-14.13%
jan 1, 1978
5.633
-0.442
-7.27%
jan 1, 1979
4.667
-0.966
-17.15%
jan 1, 1980
5.56
+0.893
19.14%
jan 1, 1981
6.188
+0.628
11.3%
jan 1, 1982
6.702
+0.513
8.3%
jan 1, 1983
8.072
+1.37
20.44%
jan 1, 1984
6.969
-1.103
-13.67%
jan 1, 1985
6.439
-0.529
-7.59%
jan 1, 1986
6.993
+0.554
8.6%
jan 1, 1987
5.295
-1.698
-24.28%
jan 1, 1988
4.783
-0.512
-9.67%
jan 1, 1989
4.185
-0.598
-12.5%
jan 1, 1990
4.3
+0.114
2.73%
jan 1, 1991
4.81
+0.51
11.86%
jan 1, 1992
4.858
+0.048
1.01%
jan 1, 1993
4.433
-0.425
-8.75%
jan 1, 1994
4.189
-0.244
-5.51%
jan 1, 1995
3.684
-0.505
-12.05%
jan 1, 1996
3.559
-0.125
-3.41%
jan 1, 1997
4.036
+0.477
13.41%
jan 1, 1998
3.834
-0.201
-4.99%
jan 1, 1999
3.137
-0.697
-18.18%
jan 1, 2000
3.165
+0.028
0.89%
jan 1, 2001
4.715
+1.55
48.96%
jan 1, 2002
4.796
+0.081
1.72%
jan 1, 2003
4.359
-0.437
-9.11%
jan 1, 2004
5.372
+1.012
23.22%
jan 1, 2005
6.101
+0.729
13.57%
jan 1, 2006
7.537
+1.436
23.54%
jan 1, 2007
7.814
+0.277
3.68%
jan 1, 2008
8.246
+0.432
5.53%
jan 1, 2009
11.9
+3.654
44.31%
jan 1, 2010
10.261
-1.639
-13.77%
jan 1, 2011
11.624
+1.363
13.28%
jan 1, 2012
14.36
+2.736
23.54%
jan 1, 2013
14.055
-0.305
-2.12%
jan 1, 2014
14.779
+0.724
5.15%
jan 1, 2015
15.09
+0.31
2.1%
jan 1, 2016
11.341
-3.749
-24.84%
Ranking of countries by current statistics by years


Comments: