29
/
en
AIzaSyAYiBZKx7MnpbEhh9jyipgxe19OcubqV5w
April 1, 2024
57042
South Asia
SAS
false
2
1
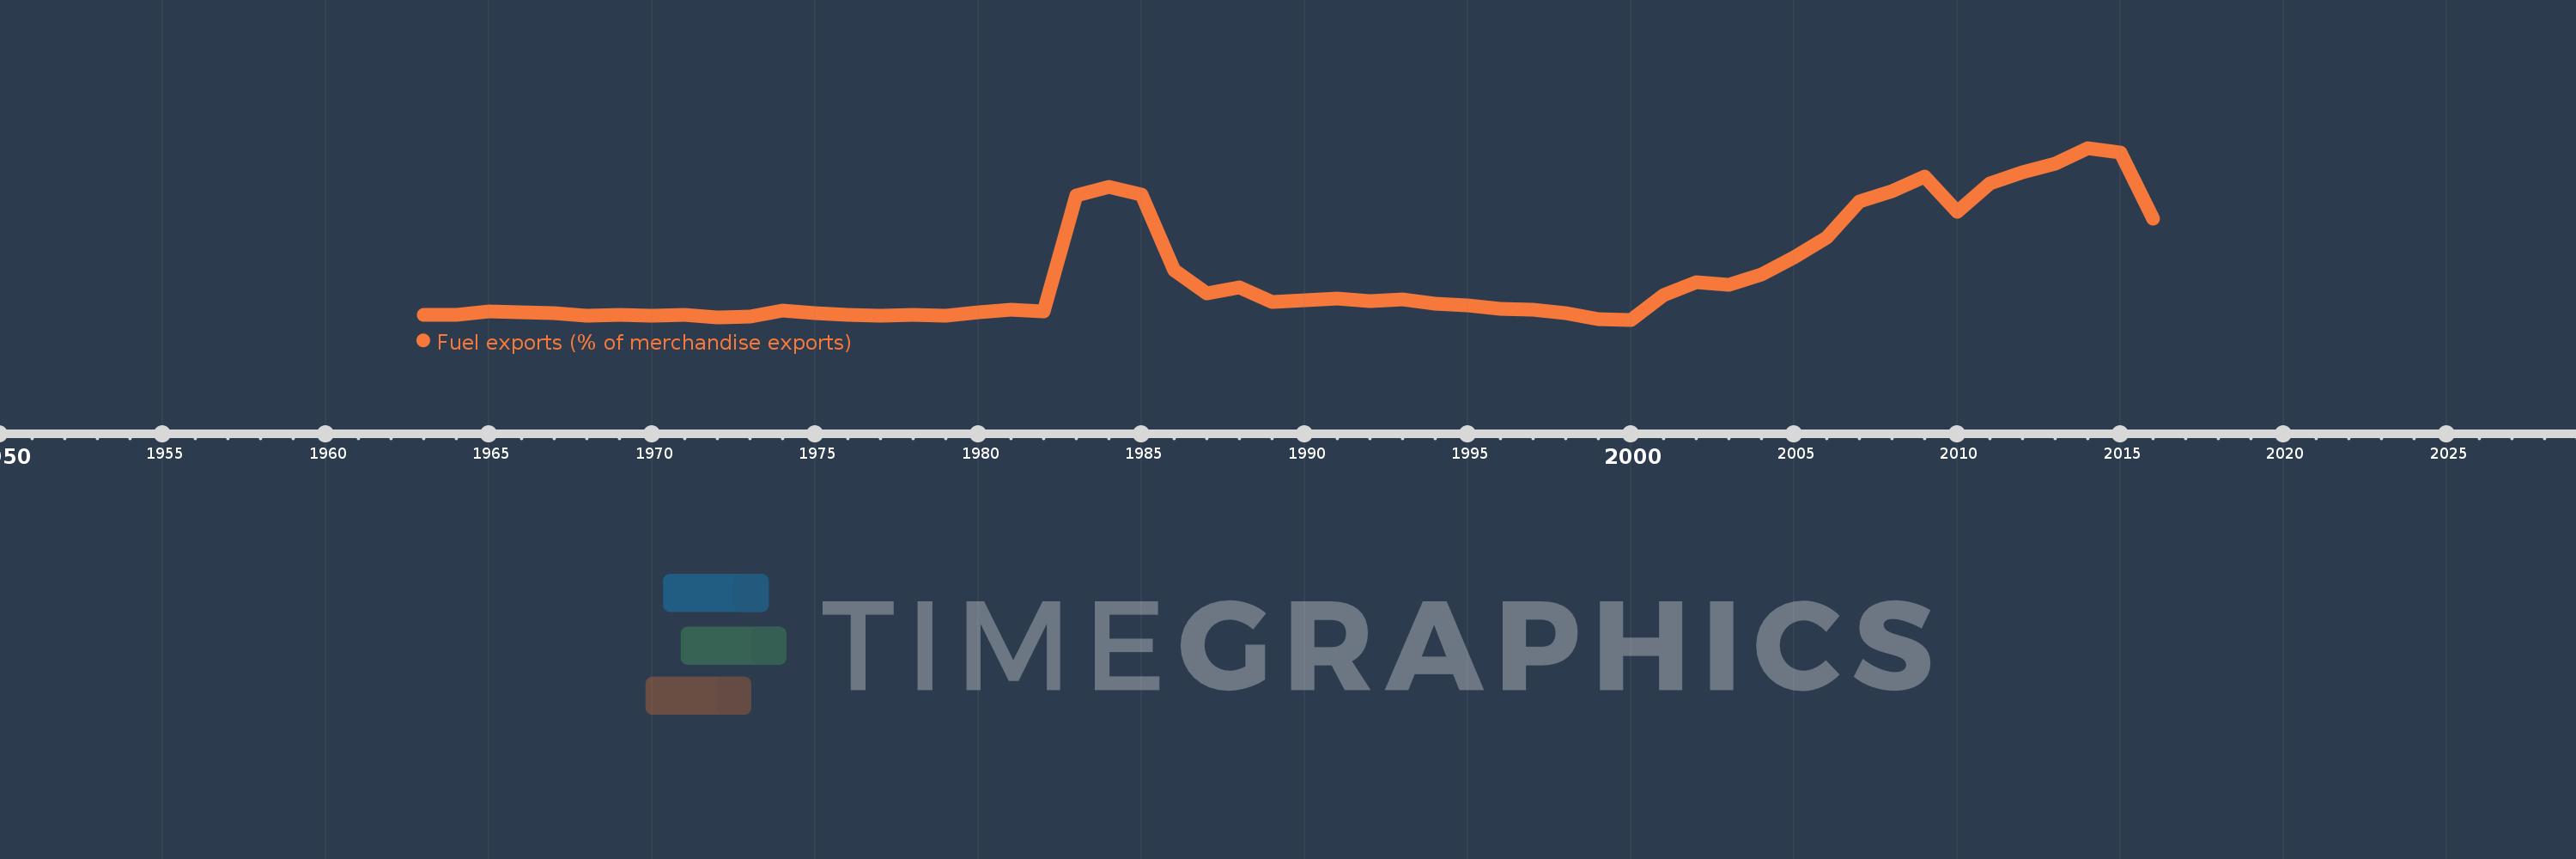
Fuel exports (% of merchandise exports)
2016,2015,2014,2013,2012,2011,2010,2009,2008,2007,2006,2005,2004,2003,2002,2001,2000,1999,1998,1997,1996,1995,1994,1993,1992,1991,1990,1989,1988,1987,1986,1985,1984,1983,1982,1981,1980,1979,1978,1977,1976,1975,1974,1973,1972,1971,1970,1969,1968,1967,1966,1965,1964,1963
This statistics in other country:
AfghanistanAlbaniaAlgeriaAndorraAngolaAntigua and BarbudaArab WorldArgentinaArmeniaArubaAustraliaAustriaAzerbaijanBahamas, TheBahrainBangladeshBarbadosBelarusBelgiumBelizeBeninBermudaBhutanBoliviaBosnia and HerzegovinaBotswanaBrazilBrunei DarussalamBulgariaBurkina FasoBurundiCabo VerdeCambodiaCameroonCanadaCaribbean small statesCayman IslandsCentral African RepublicCentral Europe and the BalticsChadChileChinaColombiaComorosCongo, Dem. Rep.Congo, Rep.Costa RicaCote d'IvoireCroatiaCubaCyprusCzech RepublicDenmarkDjiboutiDominicaDominican RepublicEarly-demographic dividendEast Asia & PacificEast Asia & Pacific (excluding high income)East Asia & Pacific (IDA & IBRD countries)EcuadorEgypt, Arab Rep.El SalvadorEquatorial GuineaEritreaEstoniaEthiopiaEuro areaEurope & Central AsiaEurope & Central Asia (excluding high income)Europe & Central Asia (IDA & IBRD countries)European UnionFaroe IslandsFijiFinlandFragile and conflict affected situationsFranceFrench PolynesiaGabonGambia, TheGeorgiaGermanyGhanaGreeceGreenlandGrenadaGuatemalaGuineaGuinea-BissauGuyanaHaitiHeavily indebted poor countries (HIPC)High incomeHondurasHong Kong SAR, ChinaHungaryIBRD onlyIcelandIDA & IBRD totalIDA blendIDA onlyIDA totalIndiaIndonesiaIran, Islamic Rep.IraqIrelandIsraelItalyJamaicaJapanJordanKazakhstanKenyaKiribatiKorea, Rep.KuwaitKyrgyz RepublicLao PDRLate-demographic dividendLatin America & Caribbean Latin America & Caribbean (excluding high income)Latin America & the Caribbean (IDA & IBRD countries)LatviaLeast developed countries: UN classificationLebanonLesothoLiberiaLibyaLithuaniaLow & middle incomeLower middle incomeLuxembourgMacao SAR, ChinaMacedonia, FYRMadagascarMalawiMalaysiaMaldivesMaliMaltaMauritaniaMauritiusMexicoMiddle East & North AfricaMiddle East & North Africa (excluding high income)Middle East & North Africa (IDA & IBRD countries)Middle incomeMoldovaMongoliaMoroccoMozambiqueMyanmarNamibiaNepalNetherlandsNew CaledoniaNew ZealandNicaraguaNigerNigeriaNorth AmericaNorwayOECD membersOmanOther small statesPacific island small statesPakistanPalauPanamaPapua New GuineaParaguayPeruPhilippinesPolandPortugalPost-demographic dividendPre-demographic dividendQatarRomaniaRussian FederationRwandaSamoaSao Tome and PrincipeSaudi ArabiaSenegalSerbiaSeychellesSierra LeoneSingaporeSlovak RepublicSloveniaSmall statesSolomon IslandsSomaliaSouth AfricaSouth AsiaSouth Asia (IDA & IBRD)SpainSri LankaSt. Kitts and NevisSt. LuciaSt. Vincent and the GrenadinesSub-Saharan Africa Sub-Saharan Africa (excluding high income)Sub-Saharan Africa (IDA & IBRD countries)SudanSurinameSwazilandSwedenSwitzerlandSyrian Arab RepublicTajikistanTanzaniaThailandTimor-LesteTogoTongaTrinidad and TobagoTunisiaTurkeyTurkmenistanTurks and Caicos IslandsTuvaluUgandaUkraineUnited Arab EmiratesUnited KingdomUnited StatesUpper middle incomeUruguayVanuatuVenezuela, RBVietnamVirgin Islands (U.S.)WorldYemen, Rep.ZambiaZimbabwe Timeline:
This timeline shows a graph from 1963 to 2016 of South Asia. No data until 1962. Number of actual observations by date: 54.
Source name:
World Development Indicators
Source organization:
World Bank staff estimates from the Comtrade database maintained by the United Nations Statistics Division.
Categories, topics:
Energy & Mining, Private Sector, Trade
Last updated:
apr 23, 2017
Indicators value changes by year
Maximum:
18.079
jan 1, 2014
At the date of observation
Value
Absolute change
Change from previous value
jan 1, 1963
0.864
+0.864
0.0%
jan 1, 1964
0.899
+0.035
4.09%
jan 1, 1965
1.263
+0.364
40.51%
jan 1, 1966
1.132
-0.131
-10.39%
jan 1, 1967
1.08
-0.052
-4.56%
jan 1, 1968
0.793
-0.288
-26.63%
jan 1, 1969
0.917
+0.124
15.7%
jan 1, 1970
0.812
-0.105
-11.48%
jan 1, 1971
0.862
+0.05
6.16%
jan 1, 1972
0.6
-0.262
-30.36%
jan 1, 1973
0.742
+0.142
23.69%
jan 1, 1974
1.303
+0.561
75.57%
jan 1, 1975
1.052
-0.252
-19.3%
jan 1, 1976
0.905
-0.146
-13.91%
jan 1, 1977
0.798
-0.108
-11.89%
jan 1, 1978
0.914
+0.116
14.55%
jan 1, 1979
0.829
-0.084
-9.22%
jan 1, 1980
1.139
+0.309
37.3%
jan 1, 1981
1.389
+0.25
21.94%
jan 1, 1982
1.263
-0.126
-9.08%
jan 1, 1983
13.197
+11.934
945.21%
jan 1, 1984
14.107
+0.91
6.9%
jan 1, 1985
13.275
-0.831
-5.89%
jan 1, 1986
5.512
-7.763
-58.48%
jan 1, 1987
3.111
-2.401
-43.56%
jan 1, 1988
3.725
+0.614
19.73%
jan 1, 1989
2.253
-1.471
-39.5%
jan 1, 1990
2.357
+0.104
4.62%
jan 1, 1991
2.611
+0.254
10.78%
jan 1, 1992
2.272
-0.339
-12.99%
jan 1, 1993
2.513
+0.24
10.58%
jan 1, 1994
2.03
-0.482
-19.2%
jan 1, 1995
1.83
-0.2
-9.86%
jan 1, 1996
1.518
-0.312
-17.04%
jan 1, 1997
1.397
-0.121
-7.99%
jan 1, 1998
1.07
-0.326
-23.37%
jan 1, 1999
0.481
-0.589
-55.02%
jan 1, 2000
0.39
-0.091
-18.91%
jan 1, 2001
2.923
+2.532
648.63%
jan 1, 2002
4.217
+1.294
44.27%
jan 1, 2003
3.974
-0.243
-5.77%
jan 1, 2004
5.08
+1.107
27.85%
jan 1, 2005
6.849
+1.768
34.81%
jan 1, 2006
8.894
+2.046
29.87%
jan 1, 2007
12.591
+3.697
41.56%
jan 1, 2008
13.665
+1.074
8.53%
jan 1, 2009
15.164
+1.5
10.97%
jan 1, 2010
11.465
-3.7
-24.4%
jan 1, 2011
14.413
+2.948
25.71%
jan 1, 2012
15.617
+1.204
8.35%
jan 1, 2013
16.44
+0.824
5.27%
jan 1, 2014
18.079
+1.639
9.97%
jan 1, 2015
17.567
-0.513
-2.84%
jan 1, 2016
10.767
-6.8
-38.71%
Ranking of countries by current statistics by years


Comments: