29
/
en
AIzaSyAYiBZKx7MnpbEhh9jyipgxe19OcubqV5w
April 1, 2024
52049
North America
NAC
false
2
1
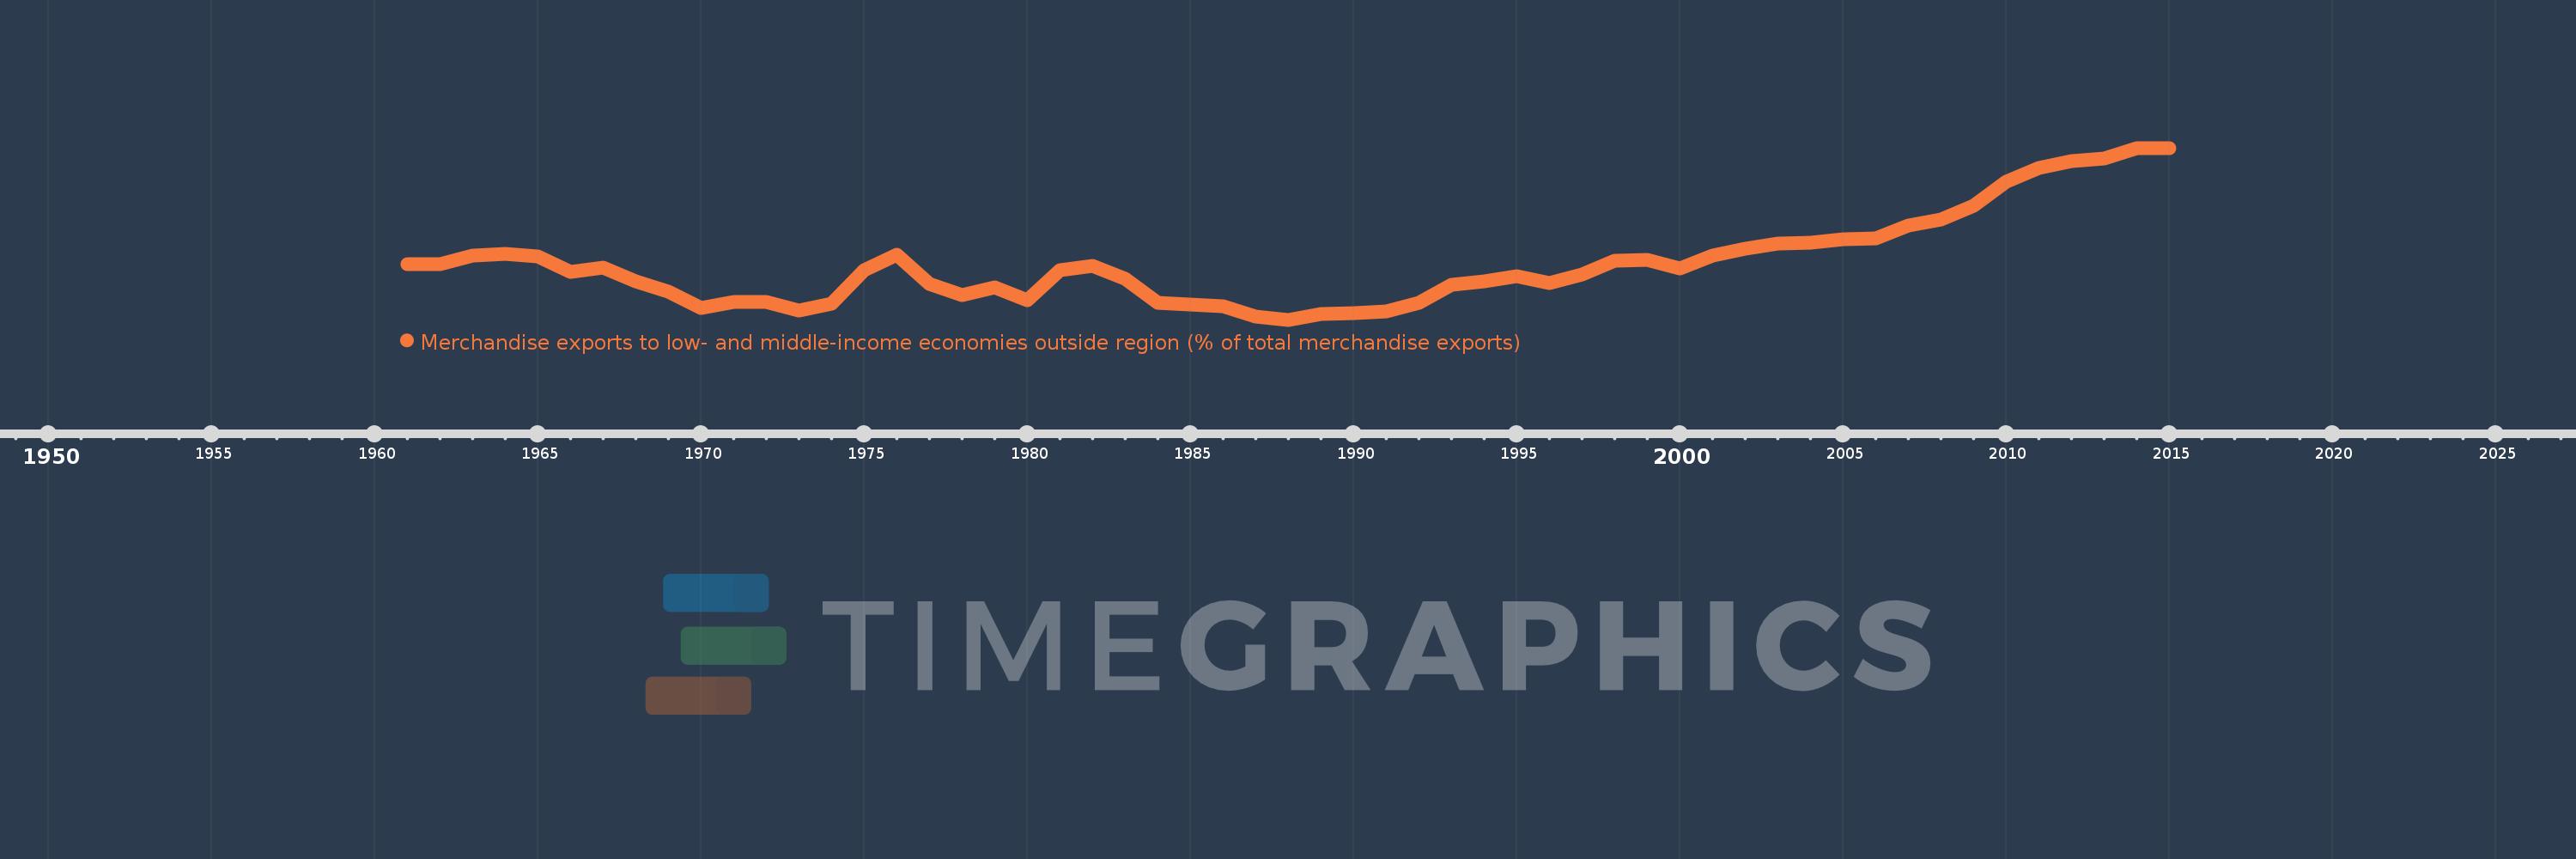
Merchandise exports to low- and middle-income economies outside region (% of total merchandise exports)
2015,2014,2013,2012,2011,2010,2009,2008,2007,2006,2005,2004,2003,2002,2001,2000,1999,1998,1997,1996,1995,1994,1993,1992,1991,1990,1989,1988,1987,1986,1985,1984,1983,1982,1981,1980,1979,1978,1977,1976,1975,1974,1973,1972,1971,1970,1969,1968,1967,1966,1965,1964,1963,1962,1961
This statistics in other country:
AfghanistanAlbaniaAlgeriaAngolaArab WorldArgentinaArmeniaArubaAustraliaAustriaAzerbaijanBahamas, TheBahrainBangladeshBarbadosBelarusBelgiumBelizeBeninBermudaBoliviaBrazilBrunei DarussalamBulgariaBurundiCabo VerdeCambodiaCameroonCanadaCaribbean small statesCentral African RepublicCentral Europe and the BalticsChileChinaColombiaCongo, Dem. Rep.Congo, Rep.Costa RicaCote d'IvoireCroatiaCubaCyprusCzech RepublicDenmarkDominicaDominican RepublicEarly-demographic dividendEast Asia & PacificEast Asia & Pacific (excluding high income)East Asia & Pacific (IDA & IBRD countries)EcuadorEgypt, Arab Rep.El SalvadorEstoniaEthiopiaEuro areaEurope & Central AsiaEurope & Central Asia (excluding high income)Europe & Central Asia (IDA & IBRD countries)European UnionFijiFinlandFragile and conflict affected situationsFranceGabonGambia, TheGeorgiaGermanyGhanaGreeceGreenlandGuatemalaGuineaGuyanaHaitiHeavily indebted poor countries (HIPC)High incomeHondurasHong Kong SAR, ChinaHungaryIBRD onlyIcelandIDA & IBRD totalIDA blendIDA onlyIDA totalIndiaIndonesiaIran, Islamic Rep.IraqIrelandIsraelItalyJamaicaJapanJordanKazakhstanKenyaKorea, Dem. People’s Rep.Korea, Rep.KuwaitLao PDRLate-demographic dividendLatin America & Caribbean Latin America & Caribbean (excluding high income)Latin America & the Caribbean (IDA & IBRD countries)LatviaLeast developed countries: UN classificationLebanonLiberiaLibyaLithuaniaLow & middle incomeLow incomeLower middle incomeLuxembourgMacao SAR, ChinaMacedonia, FYRMadagascarMalawiMalaysiaMaliMaltaMauritaniaMauritiusMexicoMiddle East & North AfricaMiddle East & North Africa (excluding high income)Middle East & North Africa (IDA & IBRD countries)Middle incomeMoldovaMongoliaMontenegroMoroccoMozambiqueMyanmarNetherlandsNew CaledoniaNew ZealandNicaraguaNigerNigeriaNorth AmericaNorwayOECD membersOmanOther small statesPacific island small statesPakistanPanamaPapua New GuineaParaguayPeruPhilippinesPolandPortugalPost-demographic dividendPre-demographic dividendQatarRomaniaRussian FederationRwandaSamoaSaudi ArabiaSenegalSerbiaSeychellesSierra LeoneSingaporeSlovak RepublicSloveniaSmall statesSomaliaSouth AfricaSouth AsiaSouth Asia (IDA & IBRD)SpainSri LankaSt. LuciaSt. Vincent and the GrenadinesSub-Saharan Africa Sub-Saharan Africa (excluding high income)Sub-Saharan Africa (IDA & IBRD countries)SudanSurinameSwedenSwitzerlandSyrian Arab RepublicTanzaniaThailandTogoTrinidad and TobagoTunisiaTurkeyUgandaUkraineUnited Arab EmiratesUnited KingdomUnited StatesUpper middle incomeUruguayVenezuela, RBVietnamWorldYemen, Rep.ZambiaZimbabwe Timeline:
This timeline shows a graph from 1961 to 2015 of North America. No data until 1960. Number of actual observations by date: 55.
Source name:
World Development Indicators
Source organization:
World Bank staff estimates based data from International Monetary Fund's Direction of Trade database.
Categories, topics:
Private Sector, Trade
Last updated:
apr 23, 2017
Indicators value changes by year
Minimum:
15.079
jan 1, 1988
Maximum:
32.129
jan 1, 2014
At the date of observation
Value
Absolute change
Change from previous value
jan 1, 1961
20.558
+20.558
0.0%
jan 1, 1962
20.58
+0.022
0.11%
jan 1, 1963
21.474
+0.893
4.34%
jan 1, 1964
21.582
+0.108
0.51%
jan 1, 1965
21.33
-0.253
-1.17%
jan 1, 1966
19.869
-1.46
-6.85%
jan 1, 1967
20.277
+0.407
2.05%
jan 1, 1968
18.912
-1.365
-6.73%
jan 1, 1969
17.85
-1.062
-5.62%
jan 1, 1970
16.226
-1.624
-9.1%
jan 1, 1971
16.861
+0.635
3.92%
jan 1, 1972
16.809
-0.052
-0.31%
jan 1, 1973
15.958
-0.851
-5.06%
jan 1, 1974
16.68
+0.722
4.53%
jan 1, 1975
20.022
+3.342
20.03%
jan 1, 1976
21.496
+1.474
7.36%
jan 1, 1977
18.621
-2.875
-13.38%
jan 1, 1978
17.515
-1.106
-5.94%
jan 1, 1979
18.28
+0.765
4.37%
jan 1, 1980
17.002
-1.278
-6.99%
jan 1, 1981
19.973
+2.971
17.47%
jan 1, 1982
20.43
+0.457
2.29%
jan 1, 1983
19.111
-1.319
-6.45%
jan 1, 1984
16.749
-2.362
-12.36%
jan 1, 1985
16.591
-0.158
-0.94%
jan 1, 1986
16.409
-0.183
-1.1%
jan 1, 1987
15.393
-1.016
-6.19%
jan 1, 1988
15.079
-0.314
-2.04%
jan 1, 1989
15.671
+0.592
3.93%
jan 1, 1990
15.752
+0.082
0.52%
jan 1, 1991
15.914
+0.161
1.02%
jan 1, 1992
16.783
+0.87
5.46%
jan 1, 1993
18.57
+1.786
10.64%
jan 1, 1994
18.906
+0.336
1.81%
jan 1, 1995
19.369
+0.463
2.45%
jan 1, 1996
18.701
-0.668
-3.45%
jan 1, 1997
19.56
+0.859
4.59%
jan 1, 1998
20.928
+1.368
6.99%
jan 1, 1999
21.059
+0.131
0.62%
jan 1, 2000
20.204
-0.855
-4.06%
jan 1, 2001
21.449
+1.245
6.16%
jan 1, 2002
22.087
+0.638
2.97%
jan 1, 2003
22.654
+0.567
2.57%
jan 1, 2004
22.76
+0.106
0.47%
jan 1, 2005
23.107
+0.347
1.53%
jan 1, 2006
23.124
+0.017
0.07%
jan 1, 2007
24.405
+1.28
5.54%
jan 1, 2008
25.048
+0.644
2.64%
jan 1, 2009
26.363
+1.315
5.25%
jan 1, 2010
28.74
+2.377
9.02%
jan 1, 2011
30.133
+1.393
4.85%
jan 1, 2012
30.851
+0.717
2.38%
jan 1, 2013
31.121
+0.271
0.88%
jan 1, 2014
32.129
+1.007
3.24%
jan 1, 2015
32.1
-0.029
-0.09%
Ranking of countries by current statistics by years


Comments: