29
/
en
AIzaSyAYiBZKx7MnpbEhh9jyipgxe19OcubqV5w
April 1, 2024
275938
United Kingdom
GBR
true
2
1
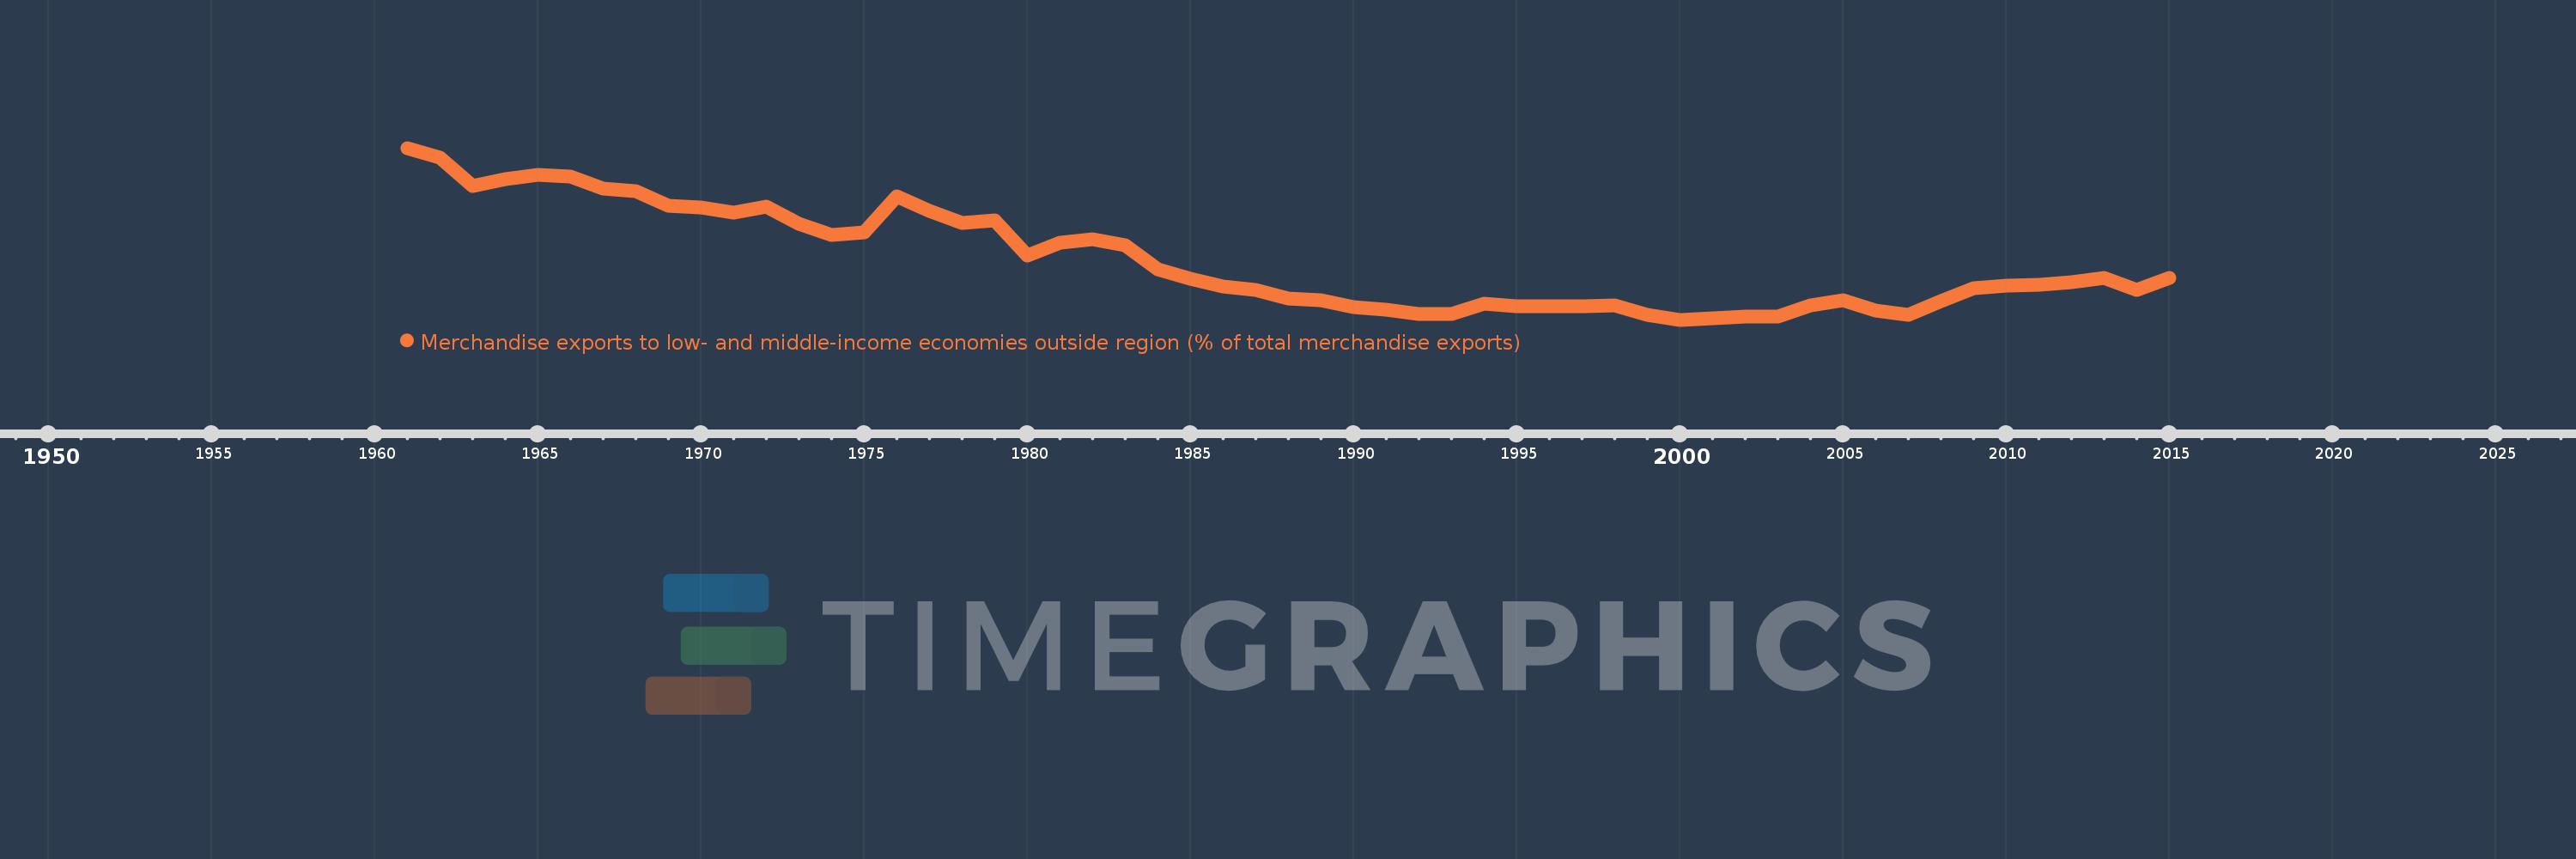
Merchandise exports to low- and middle-income economies outside region (% of total merchandise exports)
2015,2014,2013,2012,2011,2010,2009,2008,2007,2006,2005,2004,2003,2002,2001,2000,1999,1998,1997,1996,1995,1994,1993,1992,1991,1990,1989,1988,1987,1986,1985,1984,1983,1982,1981,1980,1979,1978,1977,1976,1975,1974,1973,1972,1971,1970,1969,1968,1967,1966,1965,1964,1963,1962,1961
This statistics in other country:
AfghanistanAlbaniaAlgeriaAngolaArab WorldArgentinaArmeniaArubaAustraliaAustriaAzerbaijanBahamas, TheBahrainBangladeshBarbadosBelarusBelgiumBelizeBeninBermudaBoliviaBrazilBrunei DarussalamBulgariaBurundiCabo VerdeCambodiaCameroonCanadaCaribbean small statesCentral African RepublicCentral Europe and the BalticsChileChinaColombiaCongo, Dem. Rep.Congo, Rep.Costa RicaCote d'IvoireCroatiaCubaCyprusCzech RepublicDenmarkDominicaDominican RepublicEarly-demographic dividendEast Asia & PacificEast Asia & Pacific (excluding high income)East Asia & Pacific (IDA & IBRD countries)EcuadorEgypt, Arab Rep.El SalvadorEstoniaEthiopiaEuro areaEurope & Central AsiaEurope & Central Asia (excluding high income)Europe & Central Asia (IDA & IBRD countries)European UnionFijiFinlandFragile and conflict affected situationsFranceGabonGambia, TheGeorgiaGermanyGhanaGreeceGreenlandGuatemalaGuineaGuyanaHaitiHeavily indebted poor countries (HIPC)High incomeHondurasHong Kong SAR, ChinaHungaryIBRD onlyIcelandIDA & IBRD totalIDA blendIDA onlyIDA totalIndiaIndonesiaIran, Islamic Rep.IraqIrelandIsraelItalyJamaicaJapanJordanKazakhstanKenyaKorea, Dem. People’s Rep.Korea, Rep.KuwaitLao PDRLate-demographic dividendLatin America & Caribbean Latin America & Caribbean (excluding high income)Latin America & the Caribbean (IDA & IBRD countries)LatviaLeast developed countries: UN classificationLebanonLiberiaLibyaLithuaniaLow & middle incomeLow incomeLower middle incomeLuxembourgMacao SAR, ChinaMacedonia, FYRMadagascarMalawiMalaysiaMaliMaltaMauritaniaMauritiusMexicoMiddle East & North AfricaMiddle East & North Africa (excluding high income)Middle East & North Africa (IDA & IBRD countries)Middle incomeMoldovaMongoliaMontenegroMoroccoMozambiqueMyanmarNetherlandsNew CaledoniaNew ZealandNicaraguaNigerNigeriaNorth AmericaNorwayOECD membersOmanOther small statesPacific island small statesPakistanPanamaPapua New GuineaParaguayPeruPhilippinesPolandPortugalPost-demographic dividendPre-demographic dividendQatarRomaniaRussian FederationRwandaSamoaSaudi ArabiaSenegalSerbiaSeychellesSierra LeoneSingaporeSlovak RepublicSloveniaSmall statesSomaliaSouth AfricaSouth AsiaSouth Asia (IDA & IBRD)SpainSri LankaSt. LuciaSt. Vincent and the GrenadinesSub-Saharan Africa Sub-Saharan Africa (excluding high income)Sub-Saharan Africa (IDA & IBRD countries)SudanSurinameSwedenSwitzerlandSyrian Arab RepublicTanzaniaThailandTogoTrinidad and TobagoTunisiaTurkeyUgandaUkraineUnited Arab EmiratesUnited KingdomUnited StatesUpper middle incomeUruguayVenezuela, RBVietnamWorldYemen, Rep.ZambiaZimbabwe Timeline:
This timeline shows a graph from 1961 to 2015 of United Kingdom. No data until 1960. Number of actual observations by date: 55.
Source name:
World Development Indicators
Source organization:
World Bank staff estimates based data from International Monetary Fund's Direction of Trade database.
Categories, topics:
Private Sector, Trade
Last updated:
apr 23, 2017
Indicators value changes by year
Maximum:
26.788
jan 1, 1961
At the date of observation
Value
Absolute change
Change from previous value
jan 1, 1961
26.788
+26.788
0.0%
jan 1, 1962
25.788
-1.0
-3.73%
jan 1, 1963
22.706
-3.082
-11.95%
jan 1, 1964
23.465
+0.759
3.34%
jan 1, 1965
23.902
+0.437
1.86%
jan 1, 1966
23.754
-0.149
-0.62%
jan 1, 1967
22.489
-1.264
-5.32%
jan 1, 1968
22.182
-0.307
-1.36%
jan 1, 1969
20.673
-1.509
-6.8%
jan 1, 1970
20.425
-0.248
-1.2%
jan 1, 1971
19.874
-0.551
-2.7%
jan 1, 1972
20.566
+0.692
3.48%
jan 1, 1973
18.698
-1.869
-9.09%
jan 1, 1974
17.508
-1.189
-6.36%
jan 1, 1975
17.861
+0.353
2.02%
jan 1, 1976
21.667
+3.806
21.31%
jan 1, 1977
20.078
-1.59
-7.34%
jan 1, 1978
18.809
-1.269
-6.32%
jan 1, 1979
19.05
+0.241
1.28%
jan 1, 1980
15.343
-3.707
-19.46%
jan 1, 1981
16.736
+1.393
9.08%
jan 1, 1982
17.068
+0.332
1.99%
jan 1, 1983
16.462
-0.606
-3.55%
jan 1, 1984
13.909
-2.553
-15.51%
jan 1, 1985
12.886
-1.023
-7.35%
jan 1, 1986
12.113
-0.774
-6.0%
jan 1, 1987
11.693
-0.419
-3.46%
jan 1, 1988
10.788
-0.905
-7.74%
jan 1, 1989
10.623
-0.165
-1.53%
jan 1, 1990
9.875
-0.748
-7.04%
jan 1, 1991
9.571
-0.304
-3.08%
jan 1, 1992
9.151
-0.42
-4.39%
jan 1, 1993
9.11
-0.041
-0.45%
jan 1, 1994
10.28
+1.171
12.85%
jan 1, 1995
9.979
-0.301
-2.93%
jan 1, 1996
9.981
+0.002
0.02%
jan 1, 1997
9.998
+0.017
0.17%
jan 1, 1998
10.09
+0.091
0.91%
jan 1, 1999
9.028
-1.062
-10.52%
jan 1, 2000
8.537
-0.491
-5.44%
jan 1, 2001
8.699
+0.162
1.9%
jan 1, 2002
8.83
+0.131
1.5%
jan 1, 2003
8.858
+0.028
0.32%
jan 1, 2004
10.042
+1.184
13.36%
jan 1, 2005
10.608
+0.566
5.64%
jan 1, 2006
9.552
-1.056
-9.96%
jan 1, 2007
9.071
-0.481
-5.04%
jan 1, 2008
10.529
+1.458
16.08%
jan 1, 2009
11.844
+1.315
12.49%
jan 1, 2010
12.197
+0.354
2.99%
jan 1, 2011
12.294
+0.096
0.79%
jan 1, 2012
12.527
+0.233
1.9%
jan 1, 2013
12.94
+0.414
3.3%
jan 1, 2014
11.685
-1.255
-9.7%
jan 1, 2015
13.026
+1.341
11.48%
Ranking of countries by current statistics by years


Comments: