29
/
en
AIzaSyAYiBZKx7MnpbEhh9jyipgxe19OcubqV5w
April 1, 2024
245883
South Africa
ZAF
true
2
1
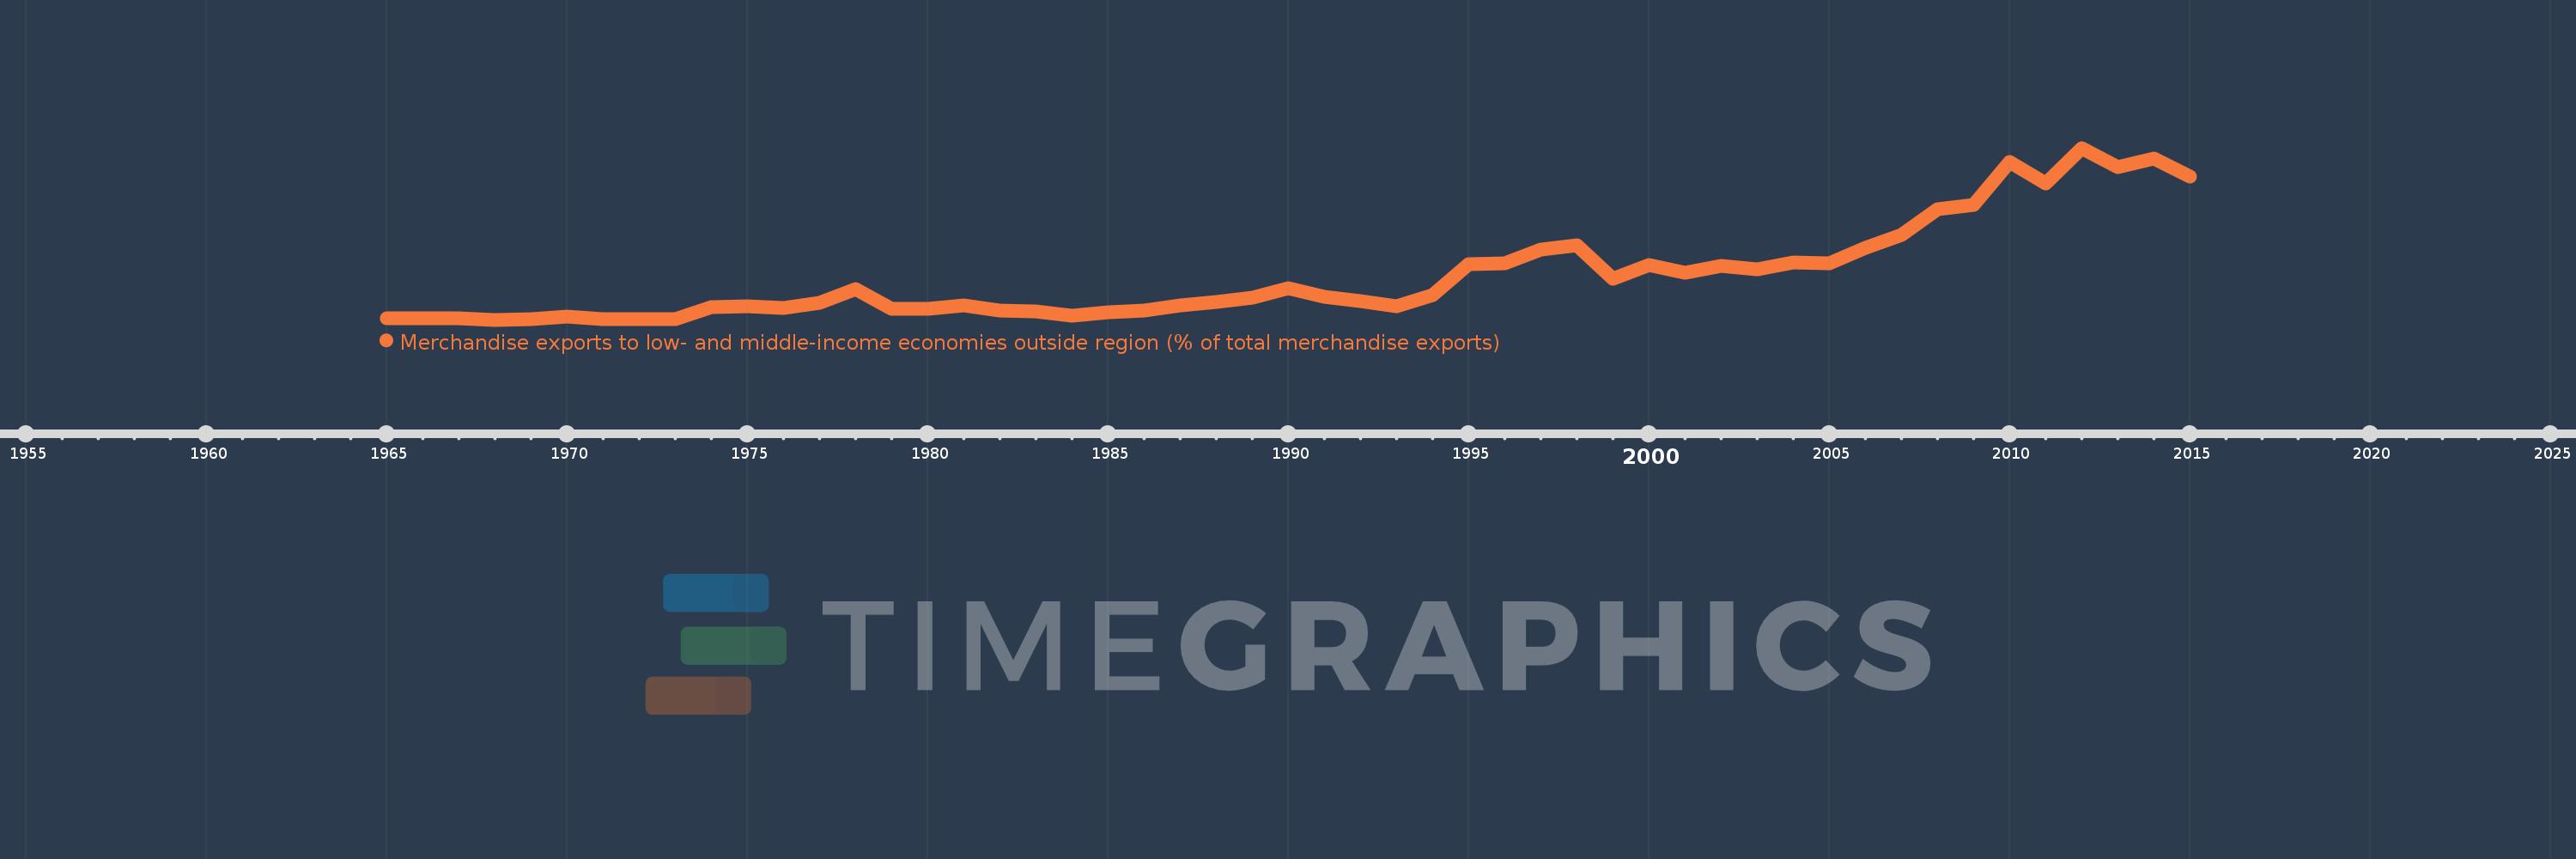
Merchandise exports to low- and middle-income economies outside region (% of total merchandise exports)
2015,2014,2013,2012,2011,2010,2009,2008,2007,2006,2005,2004,2003,2002,2001,2000,1999,1998,1997,1996,1995,1994,1993,1992,1991,1990,1989,1988,1987,1986,1985,1984,1983,1982,1981,1980,1979,1978,1977,1976,1975,1974,1973,1972,1971,1970,1969,1968,1967,1966,1965
This statistics in other country:
AfghanistanAlbaniaAlgeriaAngolaArab WorldArgentinaArmeniaArubaAustraliaAustriaAzerbaijanBahamas, TheBahrainBangladeshBarbadosBelarusBelgiumBelizeBeninBermudaBoliviaBrazilBrunei DarussalamBulgariaBurundiCabo VerdeCambodiaCameroonCanadaCaribbean small statesCentral African RepublicCentral Europe and the BalticsChileChinaColombiaCongo, Dem. Rep.Congo, Rep.Costa RicaCote d'IvoireCroatiaCubaCyprusCzech RepublicDenmarkDominicaDominican RepublicEarly-demographic dividendEast Asia & PacificEast Asia & Pacific (excluding high income)East Asia & Pacific (IDA & IBRD countries)EcuadorEgypt, Arab Rep.El SalvadorEstoniaEthiopiaEuro areaEurope & Central AsiaEurope & Central Asia (excluding high income)Europe & Central Asia (IDA & IBRD countries)European UnionFijiFinlandFragile and conflict affected situationsFranceGabonGambia, TheGeorgiaGermanyGhanaGreeceGreenlandGuatemalaGuineaGuyanaHaitiHeavily indebted poor countries (HIPC)High incomeHondurasHong Kong SAR, ChinaHungaryIBRD onlyIcelandIDA & IBRD totalIDA blendIDA onlyIDA totalIndiaIndonesiaIran, Islamic Rep.IraqIrelandIsraelItalyJamaicaJapanJordanKazakhstanKenyaKorea, Dem. People’s Rep.Korea, Rep.KuwaitLao PDRLate-demographic dividendLatin America & Caribbean Latin America & Caribbean (excluding high income)Latin America & the Caribbean (IDA & IBRD countries)LatviaLeast developed countries: UN classificationLebanonLiberiaLibyaLithuaniaLow & middle incomeLow incomeLower middle incomeLuxembourgMacao SAR, ChinaMacedonia, FYRMadagascarMalawiMalaysiaMaliMaltaMauritaniaMauritiusMexicoMiddle East & North AfricaMiddle East & North Africa (excluding high income)Middle East & North Africa (IDA & IBRD countries)Middle incomeMoldovaMongoliaMontenegroMoroccoMozambiqueMyanmarNetherlandsNew CaledoniaNew ZealandNicaraguaNigerNigeriaNorth AmericaNorwayOECD membersOmanOther small statesPacific island small statesPakistanPanamaPapua New GuineaParaguayPeruPhilippinesPolandPortugalPost-demographic dividendPre-demographic dividendQatarRomaniaRussian FederationRwandaSamoaSaudi ArabiaSenegalSerbiaSeychellesSierra LeoneSingaporeSlovak RepublicSloveniaSmall statesSomaliaSouth AfricaSouth AsiaSouth Asia (IDA & IBRD)SpainSri LankaSt. LuciaSt. Vincent and the GrenadinesSub-Saharan Africa Sub-Saharan Africa (excluding high income)Sub-Saharan Africa (IDA & IBRD countries)SudanSurinameSwedenSwitzerlandSyrian Arab RepublicTanzaniaThailandTogoTrinidad and TobagoTunisiaTurkeyUgandaUkraineUnited Arab EmiratesUnited KingdomUnited StatesUpper middle incomeUruguayVenezuela, RBVietnamWorldYemen, Rep.ZambiaZimbabwe Timeline:
This timeline shows a graph from 1965 to 2015 of South Africa. No data until 1964. Number of actual observations by date: 51.
Source name:
World Development Indicators
Source organization:
World Bank staff estimates based data from International Monetary Fund's Direction of Trade database.
Categories, topics:
Private Sector, Trade
Last updated:
apr 23, 2017
Indicators value changes by year
Maximum:
22.508
jan 1, 2012
At the date of observation
Value
Absolute change
Change from previous value
jan 1, 1965
0.888
+0.888
0.0%
jan 1, 1966
0.918
+0.03
3.38%
jan 1, 1967
0.898
-0.02
-2.18%
jan 1, 1968
0.686
-0.212
-23.65%
jan 1, 1969
0.778
+0.092
13.36%
jan 1, 1970
1.053
+0.275
35.43%
jan 1, 1971
0.712
-0.341
-32.38%
jan 1, 1972
0.771
+0.059
8.33%
jan 1, 1973
0.762
-0.009
-1.19%
jan 1, 1974
2.272
+1.51
198.07%
jan 1, 1975
2.388
+0.116
5.09%
jan 1, 1976
2.17
-0.218
-9.11%
jan 1, 1977
2.835
+0.665
30.64%
jan 1, 1978
4.561
+1.727
60.91%
jan 1, 1979
2.062
-2.499
-54.79%
jan 1, 1980
2.067
+0.005
0.24%
jan 1, 1981
2.5
+0.433
20.95%
jan 1, 1982
1.838
-0.662
-26.5%
jan 1, 1983
1.741
-0.097
-5.25%
jan 1, 1984
1.185
-0.557
-31.96%
jan 1, 1985
1.622
+0.437
36.87%
jan 1, 1986
1.905
+0.283
17.47%
jan 1, 1987
2.504
+0.599
31.42%
jan 1, 1988
2.988
+0.485
19.36%
jan 1, 1989
3.438
+0.449
15.04%
jan 1, 1990
4.663
+1.225
35.63%
jan 1, 1991
3.585
-1.078
-23.12%
jan 1, 1992
3.077
-0.508
-14.17%
jan 1, 1993
2.405
-0.672
-21.85%
jan 1, 1994
3.848
+1.444
60.04%
jan 1, 1995
7.771
+3.922
101.92%
jan 1, 1996
7.836
+0.066
0.84%
jan 1, 1997
9.643
+1.807
23.06%
jan 1, 1998
10.107
+0.463
4.81%
jan 1, 1999
5.928
-4.179
-41.35%
jan 1, 2000
7.644
+1.716
28.95%
jan 1, 2001
6.602
-1.042
-13.63%
jan 1, 2002
7.507
+0.905
13.71%
jan 1, 2003
7.065
-0.442
-5.89%
jan 1, 2004
7.925
+0.86
12.18%
jan 1, 2005
7.886
-0.038
-0.48%
jan 1, 2006
9.784
+1.898
24.06%
jan 1, 2007
11.488
+1.704
17.42%
jan 1, 2008
14.702
+3.213
27.97%
jan 1, 2009
15.324
+0.622
4.23%
jan 1, 2010
20.682
+5.358
34.97%
jan 1, 2011
17.979
-2.703
-13.07%
jan 1, 2012
22.508
+4.529
25.19%
jan 1, 2013
20.122
-2.386
-10.6%
jan 1, 2014
21.141
+1.018
5.06%
jan 1, 2015
18.861
-2.279
-10.78%
Ranking of countries by current statistics by years


Comments: