29
/
en
AIzaSyAYiBZKx7MnpbEhh9jyipgxe19OcubqV5w
April 1, 2024
253288
Sudan
SDN
true
2
1
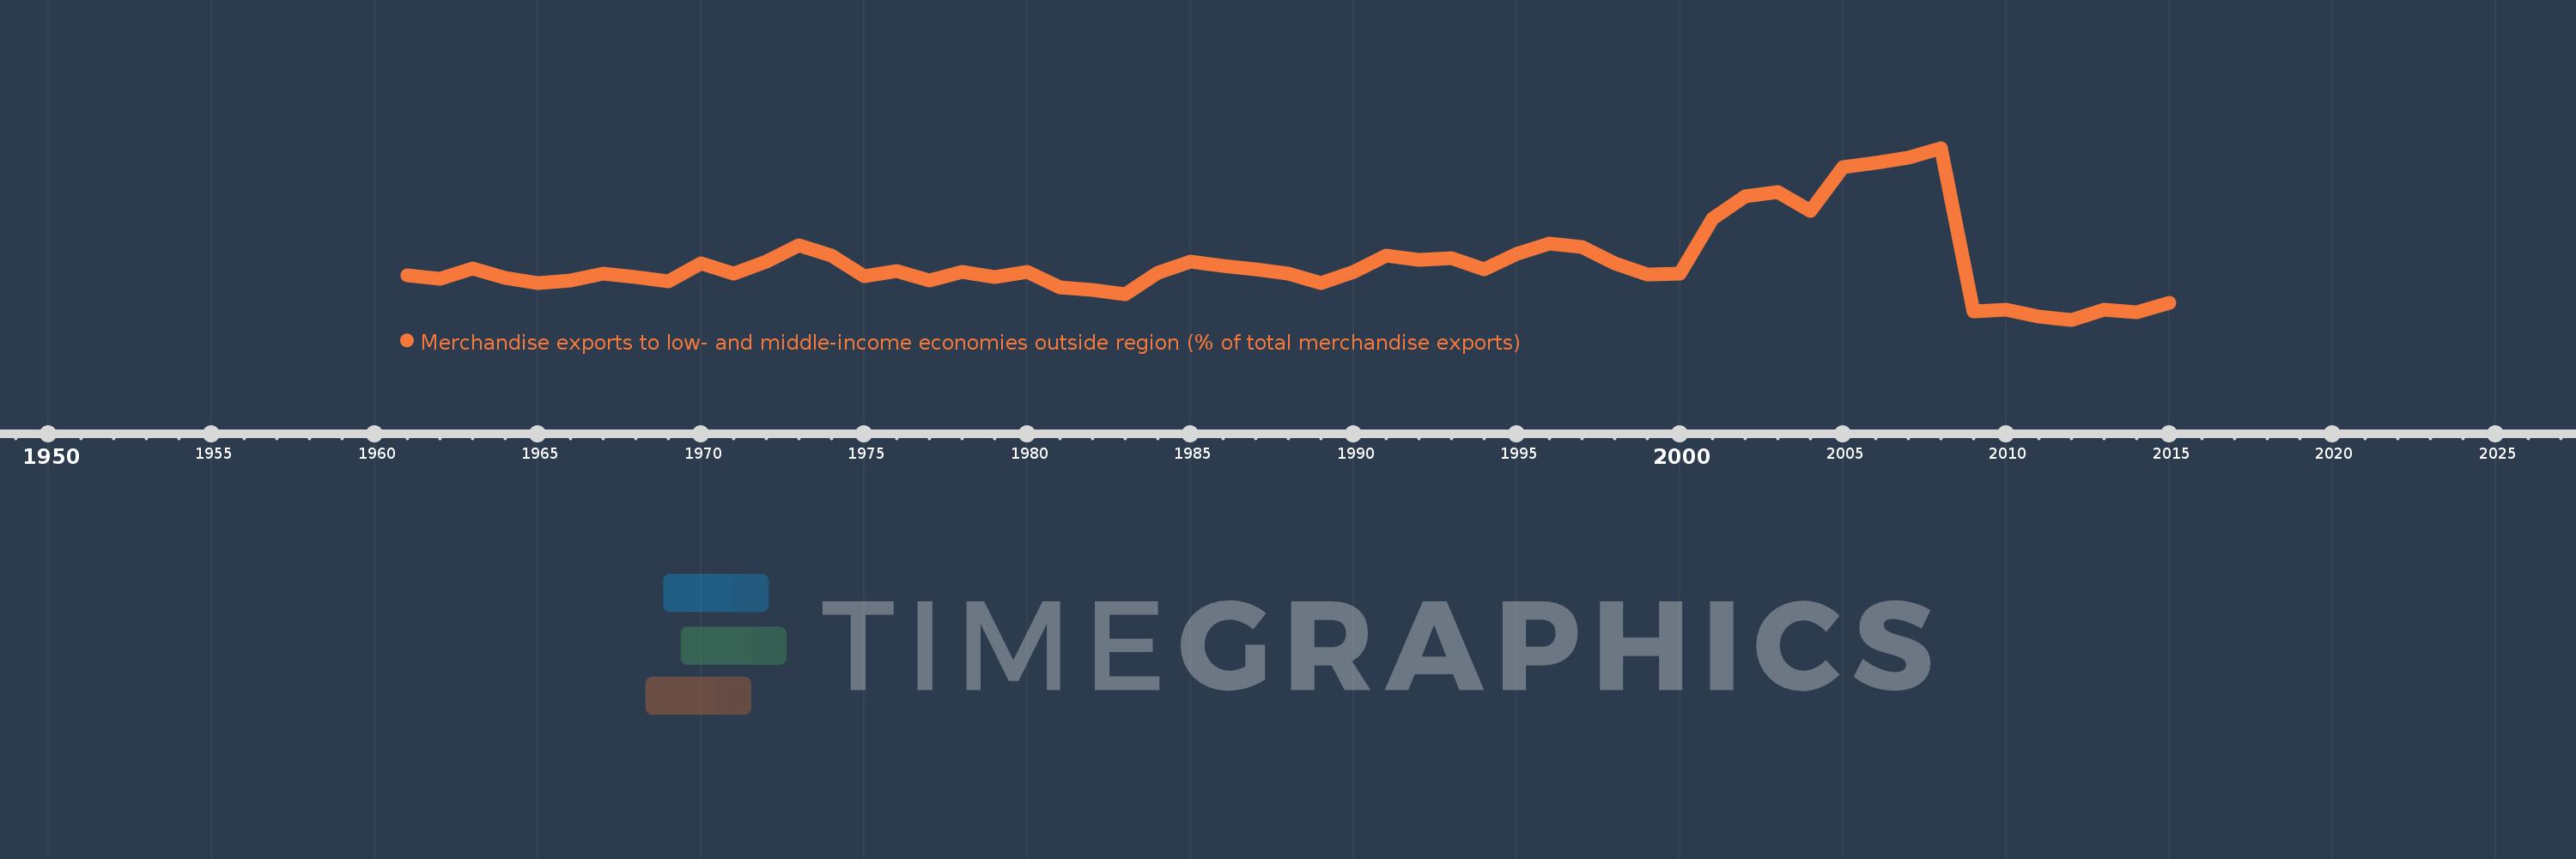
Merchandise exports to low- and middle-income economies outside region (% of total merchandise exports)
2015,2014,2013,2012,2011,2010,2009,2008,2007,2006,2005,2004,2003,2002,2001,2000,1999,1998,1997,1996,1995,1994,1993,1992,1991,1990,1989,1988,1987,1986,1985,1984,1983,1982,1981,1980,1979,1978,1977,1976,1975,1974,1973,1972,1971,1970,1969,1968,1967,1966,1965,1964,1963,1962,1961
This statistics in other country:
AfghanistanAlbaniaAlgeriaAngolaArab WorldArgentinaArmeniaArubaAustraliaAustriaAzerbaijanBahamas, TheBahrainBangladeshBarbadosBelarusBelgiumBelizeBeninBermudaBoliviaBrazilBrunei DarussalamBulgariaBurundiCabo VerdeCambodiaCameroonCanadaCaribbean small statesCentral African RepublicCentral Europe and the BalticsChileChinaColombiaCongo, Dem. Rep.Congo, Rep.Costa RicaCote d'IvoireCroatiaCubaCyprusCzech RepublicDenmarkDominicaDominican RepublicEarly-demographic dividendEast Asia & PacificEast Asia & Pacific (excluding high income)East Asia & Pacific (IDA & IBRD countries)EcuadorEgypt, Arab Rep.El SalvadorEstoniaEthiopiaEuro areaEurope & Central AsiaEurope & Central Asia (excluding high income)Europe & Central Asia (IDA & IBRD countries)European UnionFijiFinlandFragile and conflict affected situationsFranceGabonGambia, TheGeorgiaGermanyGhanaGreeceGreenlandGuatemalaGuineaGuyanaHaitiHeavily indebted poor countries (HIPC)High incomeHondurasHong Kong SAR, ChinaHungaryIBRD onlyIcelandIDA & IBRD totalIDA blendIDA onlyIDA totalIndiaIndonesiaIran, Islamic Rep.IraqIrelandIsraelItalyJamaicaJapanJordanKazakhstanKenyaKorea, Dem. People’s Rep.Korea, Rep.KuwaitLao PDRLate-demographic dividendLatin America & Caribbean Latin America & Caribbean (excluding high income)Latin America & the Caribbean (IDA & IBRD countries)LatviaLeast developed countries: UN classificationLebanonLiberiaLibyaLithuaniaLow & middle incomeLow incomeLower middle incomeLuxembourgMacao SAR, ChinaMacedonia, FYRMadagascarMalawiMalaysiaMaliMaltaMauritaniaMauritiusMexicoMiddle East & North AfricaMiddle East & North Africa (excluding high income)Middle East & North Africa (IDA & IBRD countries)Middle incomeMoldovaMongoliaMontenegroMoroccoMozambiqueMyanmarNetherlandsNew CaledoniaNew ZealandNicaraguaNigerNigeriaNorth AmericaNorwayOECD membersOmanOther small statesPacific island small statesPakistanPanamaPapua New GuineaParaguayPeruPhilippinesPolandPortugalPost-demographic dividendPre-demographic dividendQatarRomaniaRussian FederationRwandaSamoaSaudi ArabiaSenegalSerbiaSeychellesSierra LeoneSingaporeSlovak RepublicSloveniaSmall statesSomaliaSouth AfricaSouth AsiaSouth Asia (IDA & IBRD)SpainSri LankaSt. LuciaSt. Vincent and the GrenadinesSub-Saharan Africa Sub-Saharan Africa (excluding high income)Sub-Saharan Africa (IDA & IBRD countries)SudanSurinameSwedenSwitzerlandSyrian Arab RepublicTanzaniaThailandTogoTrinidad and TobagoTunisiaTurkeyUgandaUkraineUnited Arab EmiratesUnited KingdomUnited StatesUpper middle incomeUruguayVenezuela, RBVietnamWorldYemen, Rep.ZambiaZimbabwe Timeline:
This timeline shows a graph from 1961 to 2015 of Sudan. No data until 1960. Number of actual observations by date: 55.
Source name:
World Development Indicators
Source organization:
World Bank staff estimates based data from International Monetary Fund's Direction of Trade database.
Categories, topics:
Private Sector, Trade
Last updated:
apr 23, 2017
Indicators value changes by year
Maximum:
84.082
jan 1, 2008
At the date of observation
Value
Absolute change
Change from previous value
jan 1, 1961
23.445
+23.445
0.0%
jan 1, 1962
21.693
-1.752
-7.47%
jan 1, 1963
26.876
+5.183
23.89%
jan 1, 1964
22.311
-4.565
-16.98%
jan 1, 1965
19.705
-2.606
-11.68%
jan 1, 1966
20.861
+1.156
5.87%
jan 1, 1967
24.42
+3.559
17.06%
jan 1, 1968
22.746
-1.674
-6.85%
jan 1, 1969
20.405
-2.342
-10.29%
jan 1, 1970
29.032
+8.627
42.28%
jan 1, 1971
24.161
-4.872
-16.78%
jan 1, 1972
30.013
+5.852
24.22%
jan 1, 1973
37.589
+7.576
25.24%
jan 1, 1974
32.894
-4.695
-12.49%
jan 1, 1975
23.081
-9.813
-29.83%
jan 1, 1976
25.463
+2.382
10.32%
jan 1, 1977
21.074
-4.389
-17.24%
jan 1, 1978
25.274
+4.2
19.93%
jan 1, 1979
22.618
-2.656
-10.51%
jan 1, 1980
24.969
+2.351
10.39%
jan 1, 1981
17.706
-7.262
-29.09%
jan 1, 1982
16.485
-1.222
-6.9%
jan 1, 1983
14.601
-1.884
-11.43%
jan 1, 1984
24.609
+10.008
68.54%
jan 1, 1985
30.126
+5.518
22.42%
jan 1, 1986
28.054
-2.072
-6.88%
jan 1, 1987
26.246
-1.808
-6.44%
jan 1, 1988
24.399
-1.847
-7.04%
jan 1, 1989
19.709
-4.69
-19.22%
jan 1, 1990
25.095
+5.386
27.33%
jan 1, 1991
32.737
+7.642
30.45%
jan 1, 1992
30.979
-1.758
-5.37%
jan 1, 1993
31.43
+0.451
1.46%
jan 1, 1994
26.424
-5.006
-15.93%
jan 1, 1995
33.531
+7.107
26.9%
jan 1, 1996
38.614
+5.083
15.16%
jan 1, 1997
36.951
-1.663
-4.31%
jan 1, 1998
29.263
-7.688
-20.81%
jan 1, 1999
23.952
-5.311
-18.15%
jan 1, 2000
24.146
+0.195
0.81%
jan 1, 2001
50.409
+26.263
108.76%
jan 1, 2002
60.897
+10.488
20.8%
jan 1, 2003
63.081
+2.184
3.59%
jan 1, 2004
54.15
-8.931
-14.16%
jan 1, 2005
75.073
+20.923
38.64%
jan 1, 2006
77.101
+2.027
2.7%
jan 1, 2007
79.591
+2.49
3.23%
jan 1, 2008
84.082
+4.49
5.64%
jan 1, 2009
6.127
-77.955
-92.71%
jan 1, 2010
7.252
+1.125
18.36%
jan 1, 2011
3.969
-3.283
-45.27%
jan 1, 2012
2.312
-1.657
-41.74%
jan 1, 2013
7.18
+4.868
210.53%
jan 1, 2014
6.05
-1.13
-15.74%
jan 1, 2015
10.386
+4.335
71.65%
Ranking of countries by current statistics by years


Comments: