29
/
en
AIzaSyAYiBZKx7MnpbEhh9jyipgxe19OcubqV5w
April 1, 2024
51121
Middle income
MIC
false
2
1
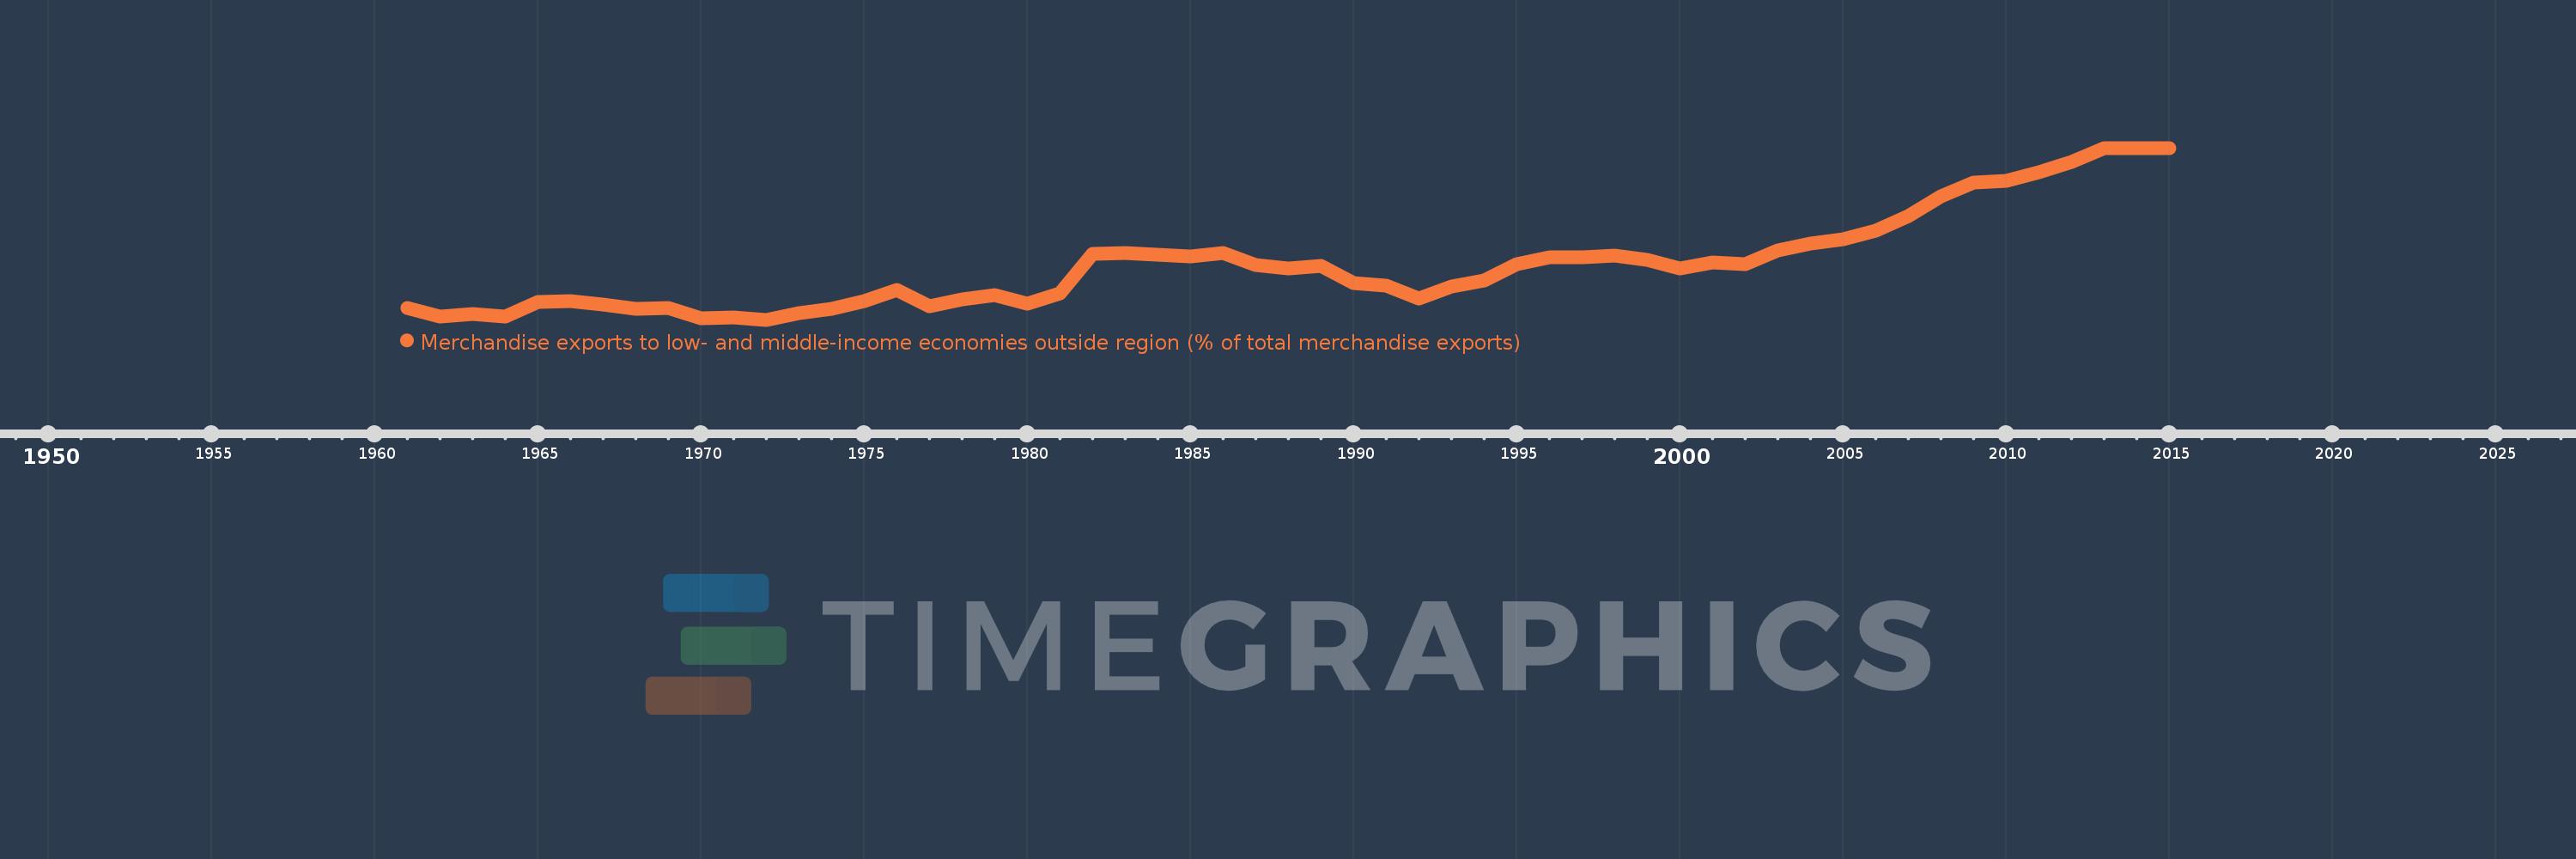
Merchandise exports to low- and middle-income economies outside region (% of total merchandise exports)
2015,2014,2013,2012,2011,2010,2009,2008,2007,2006,2005,2004,2003,2002,2001,2000,1999,1998,1997,1996,1995,1994,1993,1992,1991,1990,1989,1988,1987,1986,1985,1984,1983,1982,1981,1980,1979,1978,1977,1976,1975,1974,1973,1972,1971,1970,1969,1968,1967,1966,1965,1964,1963,1962,1961
This statistics in other country:
AfghanistanAlbaniaAlgeriaAngolaArab WorldArgentinaArmeniaArubaAustraliaAustriaAzerbaijanBahamas, TheBahrainBangladeshBarbadosBelarusBelgiumBelizeBeninBermudaBoliviaBrazilBrunei DarussalamBulgariaBurundiCabo VerdeCambodiaCameroonCanadaCaribbean small statesCentral African RepublicCentral Europe and the BalticsChileChinaColombiaCongo, Dem. Rep.Congo, Rep.Costa RicaCote d'IvoireCroatiaCubaCyprusCzech RepublicDenmarkDominicaDominican RepublicEarly-demographic dividendEast Asia & PacificEast Asia & Pacific (excluding high income)East Asia & Pacific (IDA & IBRD countries)EcuadorEgypt, Arab Rep.El SalvadorEstoniaEthiopiaEuro areaEurope & Central AsiaEurope & Central Asia (excluding high income)Europe & Central Asia (IDA & IBRD countries)European UnionFijiFinlandFragile and conflict affected situationsFranceGabonGambia, TheGeorgiaGermanyGhanaGreeceGreenlandGuatemalaGuineaGuyanaHaitiHeavily indebted poor countries (HIPC)High incomeHondurasHong Kong SAR, ChinaHungaryIBRD onlyIcelandIDA & IBRD totalIDA blendIDA onlyIDA totalIndiaIndonesiaIran, Islamic Rep.IraqIrelandIsraelItalyJamaicaJapanJordanKazakhstanKenyaKorea, Dem. People’s Rep.Korea, Rep.KuwaitLao PDRLate-demographic dividendLatin America & Caribbean Latin America & Caribbean (excluding high income)Latin America & the Caribbean (IDA & IBRD countries)LatviaLeast developed countries: UN classificationLebanonLiberiaLibyaLithuaniaLow & middle incomeLow incomeLower middle incomeLuxembourgMacao SAR, ChinaMacedonia, FYRMadagascarMalawiMalaysiaMaliMaltaMauritaniaMauritiusMexicoMiddle East & North AfricaMiddle East & North Africa (excluding high income)Middle East & North Africa (IDA & IBRD countries)Middle incomeMoldovaMongoliaMontenegroMoroccoMozambiqueMyanmarNetherlandsNew CaledoniaNew ZealandNicaraguaNigerNigeriaNorth AmericaNorwayOECD membersOmanOther small statesPacific island small statesPakistanPanamaPapua New GuineaParaguayPeruPhilippinesPolandPortugalPost-demographic dividendPre-demographic dividendQatarRomaniaRussian FederationRwandaSamoaSaudi ArabiaSenegalSerbiaSeychellesSierra LeoneSingaporeSlovak RepublicSloveniaSmall statesSomaliaSouth AfricaSouth AsiaSouth Asia (IDA & IBRD)SpainSri LankaSt. LuciaSt. Vincent and the GrenadinesSub-Saharan Africa Sub-Saharan Africa (excluding high income)Sub-Saharan Africa (IDA & IBRD countries)SudanSurinameSwedenSwitzerlandSyrian Arab RepublicTanzaniaThailandTogoTrinidad and TobagoTunisiaTurkeyUgandaUkraineUnited Arab EmiratesUnited KingdomUnited StatesUpper middle incomeUruguayVenezuela, RBVietnamWorldYemen, Rep.ZambiaZimbabwe Timeline:
This timeline shows a graph from 1961 to 2015 of Middle income. No data until 1960. Number of actual observations by date: 55.
Source name:
World Development Indicators
Source organization:
World Bank staff estimates based data from International Monetary Fund's Direction of Trade database.
Categories, topics:
Private Sector, Trade
Last updated:
apr 23, 2017
Indicators value changes by year
Maximum:
19.999
jan 1, 2013
At the date of observation
Value
Absolute change
Change from previous value
jan 1, 1961
6.117
+6.117
0.0%
jan 1, 1962
5.321
-0.795
-13.0%
jan 1, 1963
5.559
+0.238
4.47%
jan 1, 1964
5.329
-0.23
-4.14%
jan 1, 1965
6.582
+1.253
23.51%
jan 1, 1966
6.673
+0.091
1.38%
jan 1, 1967
6.381
-0.291
-4.37%
jan 1, 1968
5.99
-0.391
-6.13%
jan 1, 1969
6.063
+0.073
1.22%
jan 1, 1970
5.211
-0.851
-14.04%
jan 1, 1971
5.246
+0.035
0.67%
jan 1, 1972
5.071
-0.175
-3.34%
jan 1, 1973
5.643
+0.572
11.28%
jan 1, 1974
6.049
+0.406
7.2%
jan 1, 1975
6.705
+0.655
10.83%
jan 1, 1976
7.688
+0.983
14.66%
jan 1, 1977
6.219
-1.469
-19.11%
jan 1, 1978
6.823
+0.604
9.71%
jan 1, 1979
7.197
+0.374
5.48%
jan 1, 1980
6.456
-0.741
-10.3%
jan 1, 1981
7.365
+0.909
14.08%
jan 1, 1982
10.802
+3.437
46.66%
jan 1, 1983
10.857
+0.056
0.51%
jan 1, 1984
10.735
-0.123
-1.13%
jan 1, 1985
10.539
-0.195
-1.82%
jan 1, 1986
10.869
+0.329
3.12%
jan 1, 1987
9.862
-1.006
-9.26%
jan 1, 1988
9.512
-0.35
-3.55%
jan 1, 1989
9.78
+0.268
2.82%
jan 1, 1990
8.283
-1.497
-15.31%
jan 1, 1991
8.032
-0.251
-3.03%
jan 1, 1992
6.886
-1.146
-14.27%
jan 1, 1993
7.968
+1.081
15.7%
jan 1, 1994
8.517
+0.55
6.9%
jan 1, 1995
9.905
+1.388
16.3%
jan 1, 1996
10.499
+0.594
6.0%
jan 1, 1997
10.473
-0.026
-0.25%
jan 1, 1998
10.652
+0.178
1.7%
jan 1, 1999
10.259
-0.393
-3.69%
jan 1, 2000
9.525
-0.733
-7.15%
jan 1, 2001
10.067
+0.542
5.69%
jan 1, 2002
9.917
-0.15
-1.49%
jan 1, 2003
11.095
+1.178
11.88%
jan 1, 2004
11.686
+0.591
5.33%
jan 1, 2005
12.046
+0.36
3.08%
jan 1, 2006
12.839
+0.793
6.58%
jan 1, 2007
14.088
+1.249
9.73%
jan 1, 2008
15.781
+1.693
12.02%
jan 1, 2009
16.98
+1.199
7.6%
jan 1, 2010
17.128
+0.149
0.88%
jan 1, 2011
17.864
+0.735
4.29%
jan 1, 2012
18.763
+0.899
5.03%
jan 1, 2013
19.999
+1.236
6.59%
jan 1, 2014
19.957
-0.042
-0.21%
jan 1, 2015
19.973
+0.016
0.08%
Ranking of countries by current statistics by years


Comments: