29
/
en
AIzaSyAYiBZKx7MnpbEhh9jyipgxe19OcubqV5w
April 1, 2024
47349
Lower middle income
LMC
false
2
1
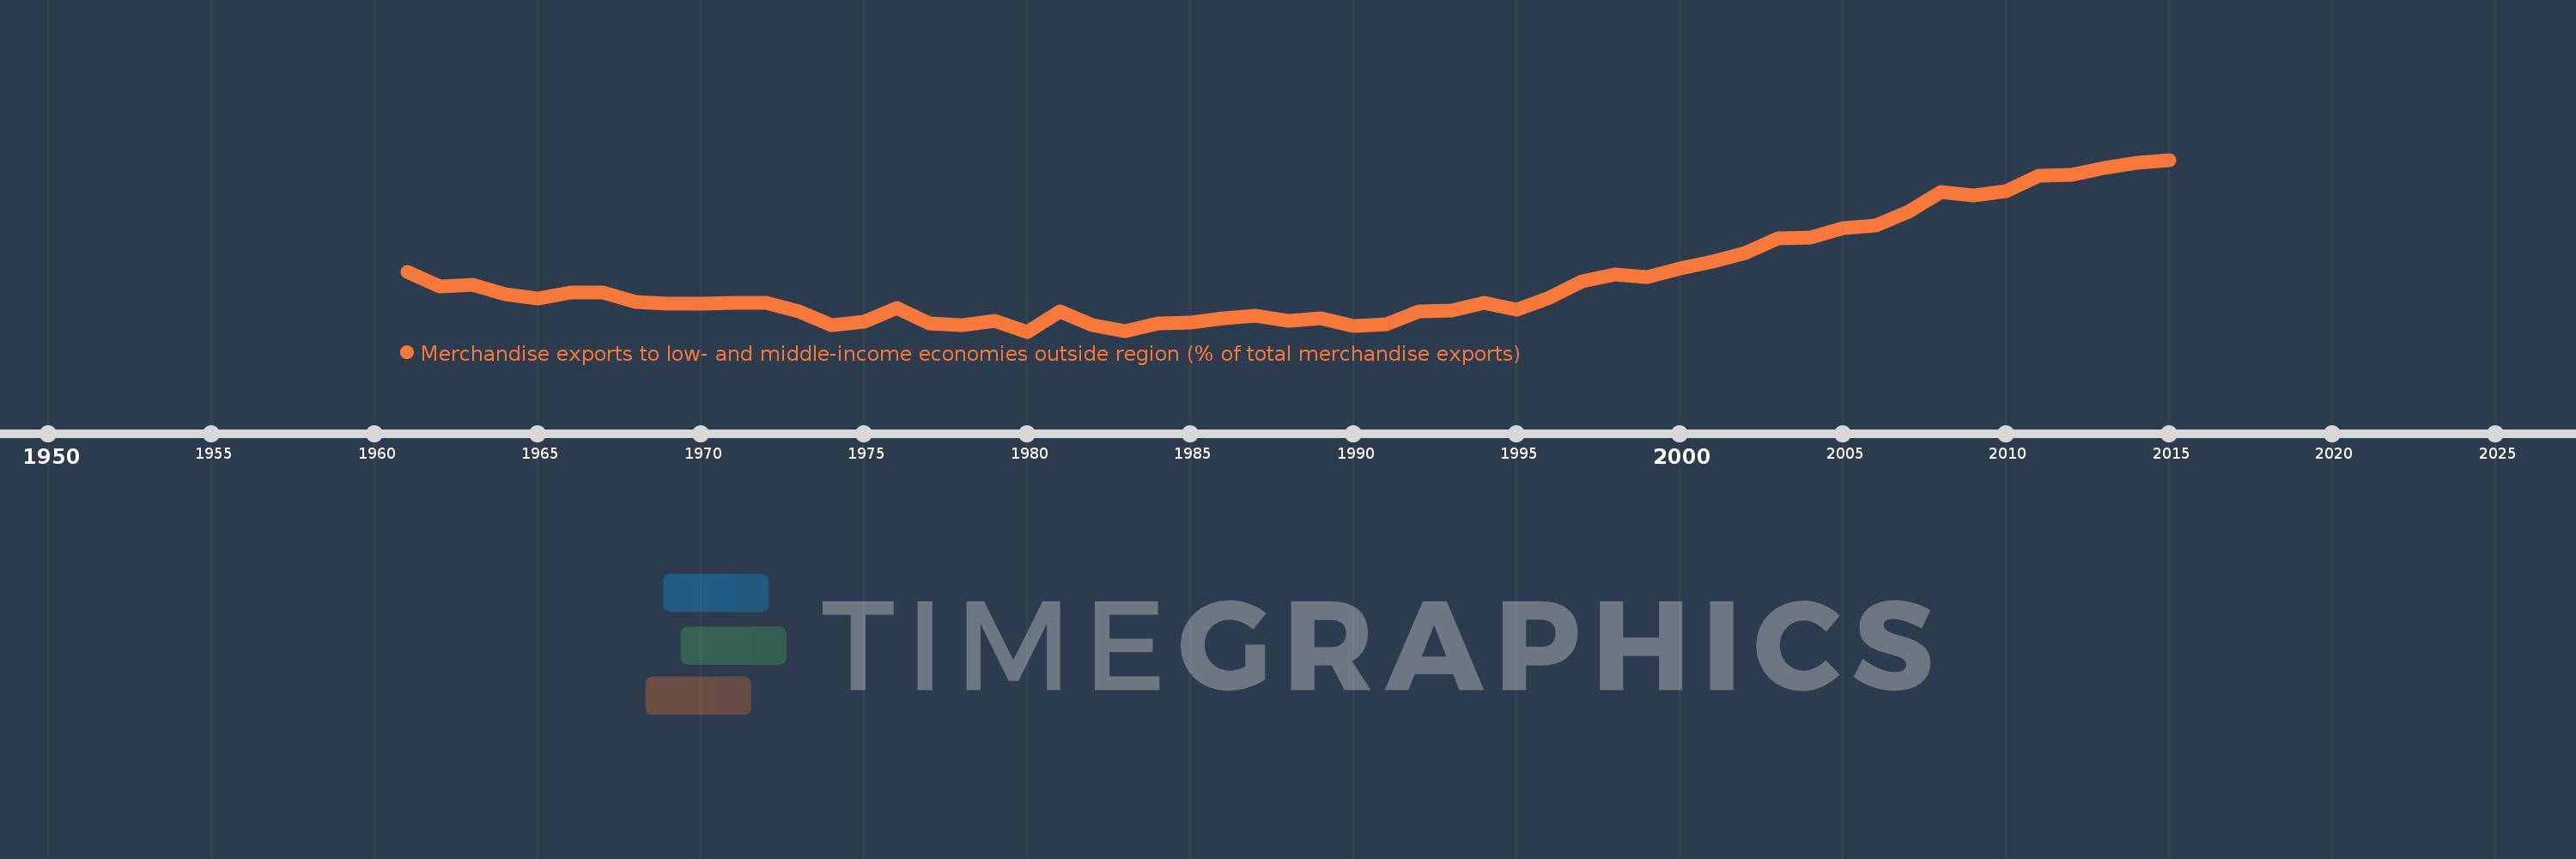
Merchandise exports to low- and middle-income economies outside region (% of total merchandise exports)
2015,2014,2013,2012,2011,2010,2009,2008,2007,2006,2005,2004,2003,2002,2001,2000,1999,1998,1997,1996,1995,1994,1993,1992,1991,1990,1989,1988,1987,1986,1985,1984,1983,1982,1981,1980,1979,1978,1977,1976,1975,1974,1973,1972,1971,1970,1969,1968,1967,1966,1965,1964,1963,1962,1961
This statistics in other country:
AfghanistanAlbaniaAlgeriaAngolaArab WorldArgentinaArmeniaArubaAustraliaAustriaAzerbaijanBahamas, TheBahrainBangladeshBarbadosBelarusBelgiumBelizeBeninBermudaBoliviaBrazilBrunei DarussalamBulgariaBurundiCabo VerdeCambodiaCameroonCanadaCaribbean small statesCentral African RepublicCentral Europe and the BalticsChileChinaColombiaCongo, Dem. Rep.Congo, Rep.Costa RicaCote d'IvoireCroatiaCubaCyprusCzech RepublicDenmarkDominicaDominican RepublicEarly-demographic dividendEast Asia & PacificEast Asia & Pacific (excluding high income)East Asia & Pacific (IDA & IBRD countries)EcuadorEgypt, Arab Rep.El SalvadorEstoniaEthiopiaEuro areaEurope & Central AsiaEurope & Central Asia (excluding high income)Europe & Central Asia (IDA & IBRD countries)European UnionFijiFinlandFragile and conflict affected situationsFranceGabonGambia, TheGeorgiaGermanyGhanaGreeceGreenlandGuatemalaGuineaGuyanaHaitiHeavily indebted poor countries (HIPC)High incomeHondurasHong Kong SAR, ChinaHungaryIBRD onlyIcelandIDA & IBRD totalIDA blendIDA onlyIDA totalIndiaIndonesiaIran, Islamic Rep.IraqIrelandIsraelItalyJamaicaJapanJordanKazakhstanKenyaKorea, Dem. People’s Rep.Korea, Rep.KuwaitLao PDRLate-demographic dividendLatin America & Caribbean Latin America & Caribbean (excluding high income)Latin America & the Caribbean (IDA & IBRD countries)LatviaLeast developed countries: UN classificationLebanonLiberiaLibyaLithuaniaLow & middle incomeLow incomeLower middle incomeLuxembourgMacao SAR, ChinaMacedonia, FYRMadagascarMalawiMalaysiaMaliMaltaMauritaniaMauritiusMexicoMiddle East & North AfricaMiddle East & North Africa (excluding high income)Middle East & North Africa (IDA & IBRD countries)Middle incomeMoldovaMongoliaMontenegroMoroccoMozambiqueMyanmarNetherlandsNew CaledoniaNew ZealandNicaraguaNigerNigeriaNorth AmericaNorwayOECD membersOmanOther small statesPacific island small statesPakistanPanamaPapua New GuineaParaguayPeruPhilippinesPolandPortugalPost-demographic dividendPre-demographic dividendQatarRomaniaRussian FederationRwandaSamoaSaudi ArabiaSenegalSerbiaSeychellesSierra LeoneSingaporeSlovak RepublicSloveniaSmall statesSomaliaSouth AfricaSouth AsiaSouth Asia (IDA & IBRD)SpainSri LankaSt. LuciaSt. Vincent and the GrenadinesSub-Saharan Africa Sub-Saharan Africa (excluding high income)Sub-Saharan Africa (IDA & IBRD countries)SudanSurinameSwedenSwitzerlandSyrian Arab RepublicTanzaniaThailandTogoTrinidad and TobagoTunisiaTurkeyUgandaUkraineUnited Arab EmiratesUnited KingdomUnited StatesUpper middle incomeUruguayVenezuela, RBVietnamWorldYemen, Rep.ZambiaZimbabwe Timeline:
This timeline shows a graph from 1961 to 2015 of Lower middle income. No data until 1960. Number of actual observations by date: 55.
Source name:
World Development Indicators
Source organization:
World Bank staff estimates based data from International Monetary Fund's Direction of Trade database.
Categories, topics:
Private Sector, Trade
Last updated:
apr 23, 2017
Indicators value changes by year
Maximum:
19.793
jan 1, 2015
At the date of observation
Value
Absolute change
Change from previous value
jan 1, 1961
9.528
+9.528
0.0%
jan 1, 1962
8.172
-1.356
-14.23%
jan 1, 1963
8.338
+0.166
2.03%
jan 1, 1964
7.432
-0.906
-10.86%
jan 1, 1965
7.07
-0.362
-4.87%
jan 1, 1966
7.602
+0.532
7.52%
jan 1, 1967
7.611
+0.009
0.12%
jan 1, 1968
6.755
-0.857
-11.26%
jan 1, 1969
6.584
-0.17
-2.52%
jan 1, 1970
6.623
+0.038
0.58%
jan 1, 1971
6.685
+0.063
0.94%
jan 1, 1972
6.69
+0.005
0.07%
jan 1, 1973
5.893
-0.798
-11.92%
jan 1, 1974
4.632
-1.261
-21.39%
jan 1, 1975
4.9
+0.268
5.8%
jan 1, 1976
6.183
+1.282
26.16%
jan 1, 1977
4.75
-1.433
-23.18%
jan 1, 1978
4.588
-0.162
-3.41%
jan 1, 1979
4.982
+0.395
8.61%
jan 1, 1980
4.021
-0.961
-19.3%
jan 1, 1981
5.859
+1.838
45.71%
jan 1, 1982
4.612
-1.247
-21.28%
jan 1, 1983
4.068
-0.544
-11.8%
jan 1, 1984
4.763
+0.695
17.08%
jan 1, 1985
4.847
+0.084
1.77%
jan 1, 1986
5.251
+0.404
8.33%
jan 1, 1987
5.443
+0.192
3.66%
jan 1, 1988
5.043
-0.4
-7.35%
jan 1, 1989
5.236
+0.193
3.83%
jan 1, 1990
4.568
-0.669
-12.77%
jan 1, 1991
4.678
+0.11
2.41%
jan 1, 1992
5.864
+1.186
25.35%
jan 1, 1993
5.963
+0.099
1.68%
jan 1, 1994
6.646
+0.683
11.46%
jan 1, 1995
6.002
-0.644
-9.69%
jan 1, 1996
7.135
+1.134
18.89%
jan 1, 1997
8.6
+1.464
20.52%
jan 1, 1998
9.304
+0.705
8.19%
jan 1, 1999
9.038
-0.266
-2.86%
jan 1, 2000
9.801
+0.764
8.45%
jan 1, 2001
10.463
+0.662
6.75%
jan 1, 2002
11.223
+0.76
7.27%
jan 1, 2003
12.614
+1.391
12.39%
jan 1, 2004
12.668
+0.055
0.43%
jan 1, 2005
13.486
+0.817
6.45%
jan 1, 2006
13.781
+0.295
2.19%
jan 1, 2007
15.018
+1.237
8.97%
jan 1, 2008
16.802
+1.785
11.88%
jan 1, 2009
16.493
-0.309
-1.84%
jan 1, 2010
16.9
+0.407
2.46%
jan 1, 2011
18.322
+1.422
8.41%
jan 1, 2012
18.401
+0.079
0.43%
jan 1, 2013
19.031
+0.631
3.43%
jan 1, 2014
19.526
+0.495
2.6%
jan 1, 2015
19.793
+0.267
1.37%
Ranking of countries by current statistics by years


Comments: