29
/
en
AIzaSyAYiBZKx7MnpbEhh9jyipgxe19OcubqV5w
April 1, 2024
268274
Tunisia
TUN
true
2
1
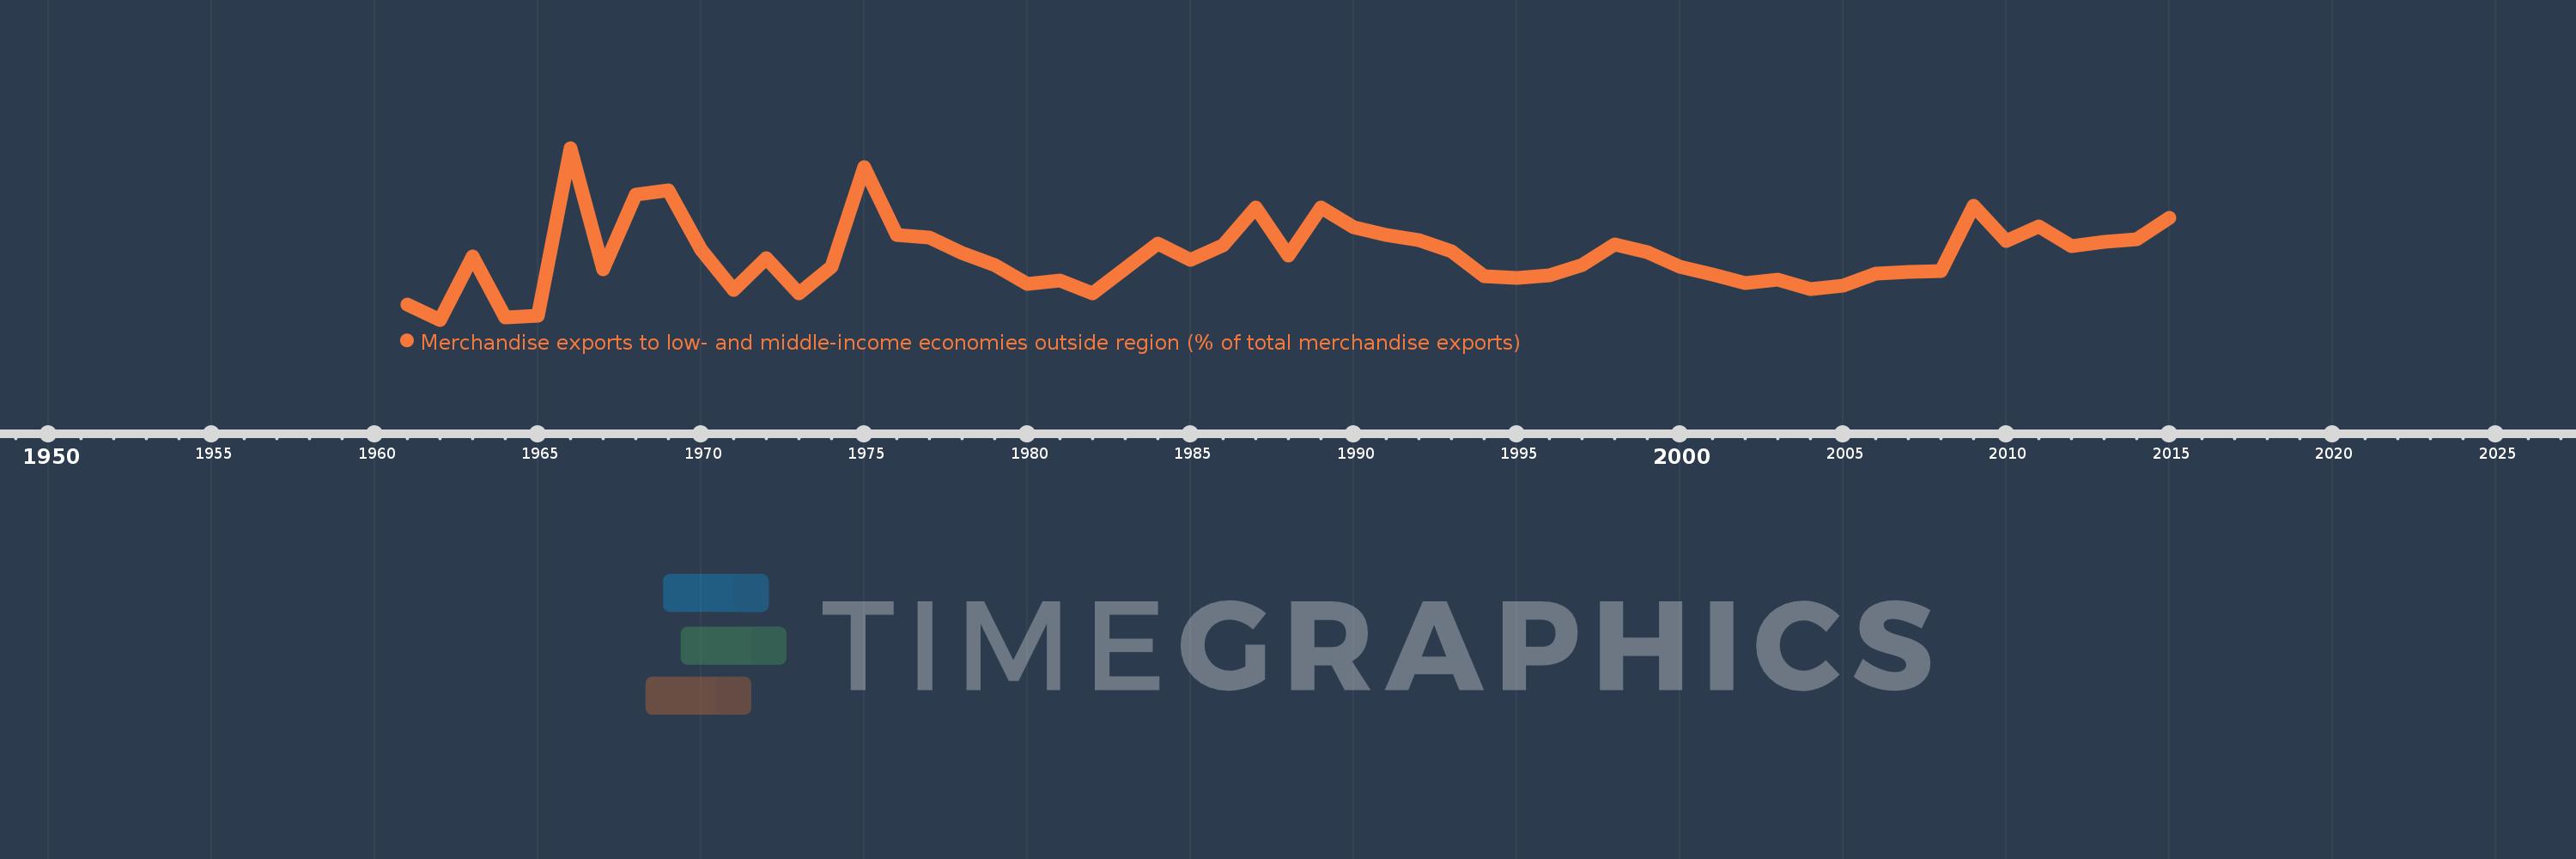
Merchandise exports to low- and middle-income economies outside region (% of total merchandise exports)
2015,2014,2013,2012,2011,2010,2009,2008,2007,2006,2005,2004,2003,2002,2001,2000,1999,1998,1997,1996,1995,1994,1993,1992,1991,1990,1989,1988,1987,1986,1985,1984,1983,1982,1981,1980,1979,1978,1977,1976,1975,1974,1973,1972,1971,1970,1969,1968,1967,1966,1965,1964,1963,1962,1961
This statistics in other country:
AfghanistanAlbaniaAlgeriaAngolaArab WorldArgentinaArmeniaArubaAustraliaAustriaAzerbaijanBahamas, TheBahrainBangladeshBarbadosBelarusBelgiumBelizeBeninBermudaBoliviaBrazilBrunei DarussalamBulgariaBurundiCabo VerdeCambodiaCameroonCanadaCaribbean small statesCentral African RepublicCentral Europe and the BalticsChileChinaColombiaCongo, Dem. Rep.Congo, Rep.Costa RicaCote d'IvoireCroatiaCubaCyprusCzech RepublicDenmarkDominicaDominican RepublicEarly-demographic dividendEast Asia & PacificEast Asia & Pacific (excluding high income)East Asia & Pacific (IDA & IBRD countries)EcuadorEgypt, Arab Rep.El SalvadorEstoniaEthiopiaEuro areaEurope & Central AsiaEurope & Central Asia (excluding high income)Europe & Central Asia (IDA & IBRD countries)European UnionFijiFinlandFragile and conflict affected situationsFranceGabonGambia, TheGeorgiaGermanyGhanaGreeceGreenlandGuatemalaGuineaGuyanaHaitiHeavily indebted poor countries (HIPC)High incomeHondurasHong Kong SAR, ChinaHungaryIBRD onlyIcelandIDA & IBRD totalIDA blendIDA onlyIDA totalIndiaIndonesiaIran, Islamic Rep.IraqIrelandIsraelItalyJamaicaJapanJordanKazakhstanKenyaKorea, Dem. People’s Rep.Korea, Rep.KuwaitLao PDRLate-demographic dividendLatin America & Caribbean Latin America & Caribbean (excluding high income)Latin America & the Caribbean (IDA & IBRD countries)LatviaLeast developed countries: UN classificationLebanonLiberiaLibyaLithuaniaLow & middle incomeLow incomeLower middle incomeLuxembourgMacao SAR, ChinaMacedonia, FYRMadagascarMalawiMalaysiaMaliMaltaMauritaniaMauritiusMexicoMiddle East & North AfricaMiddle East & North Africa (excluding high income)Middle East & North Africa (IDA & IBRD countries)Middle incomeMoldovaMongoliaMontenegroMoroccoMozambiqueMyanmarNetherlandsNew CaledoniaNew ZealandNicaraguaNigerNigeriaNorth AmericaNorwayOECD membersOmanOther small statesPacific island small statesPakistanPanamaPapua New GuineaParaguayPeruPhilippinesPolandPortugalPost-demographic dividendPre-demographic dividendQatarRomaniaRussian FederationRwandaSamoaSaudi ArabiaSenegalSerbiaSeychellesSierra LeoneSingaporeSlovak RepublicSloveniaSmall statesSomaliaSouth AfricaSouth AsiaSouth Asia (IDA & IBRD)SpainSri LankaSt. LuciaSt. Vincent and the GrenadinesSub-Saharan Africa Sub-Saharan Africa (excluding high income)Sub-Saharan Africa (IDA & IBRD countries)SudanSurinameSwedenSwitzerlandSyrian Arab RepublicTanzaniaThailandTogoTrinidad and TobagoTunisiaTurkeyUgandaUkraineUnited Arab EmiratesUnited KingdomUnited StatesUpper middle incomeUruguayVenezuela, RBVietnamWorldYemen, Rep.ZambiaZimbabwe Timeline:
This timeline shows a graph from 1961 to 2015 of Tunisia. No data until 1960. Number of actual observations by date: 55.
Source name:
World Development Indicators
Source organization:
World Bank staff estimates based data from International Monetary Fund's Direction of Trade database.
Categories, topics:
Private Sector, Trade
Last updated:
apr 23, 2017
Indicators value changes by year
Maximum:
13.761
jan 1, 1966
At the date of observation
Value
Absolute change
Change from previous value
jan 1, 1961
3.013
+3.013
0.0%
jan 1, 1962
1.995
-1.018
-33.79%
jan 1, 1963
6.309
+4.315
216.33%
jan 1, 1964
2.153
-4.156
-65.87%
jan 1, 1965
2.252
+0.098
4.57%
jan 1, 1966
13.761
+11.51
511.2%
jan 1, 1967
5.465
-8.297
-60.29%
jan 1, 1968
10.569
+5.104
93.39%
jan 1, 1969
10.846
+0.278
2.63%
jan 1, 1970
6.827
-4.019
-37.06%
jan 1, 1971
4.008
-2.819
-41.29%
jan 1, 1972
6.19
+2.182
54.44%
jan 1, 1973
3.776
-2.414
-38.99%
jan 1, 1974
5.63
+1.853
49.07%
jan 1, 1975
12.46
+6.83
121.32%
jan 1, 1976
7.795
-4.664
-37.43%
jan 1, 1977
7.652
-0.143
-1.84%
jan 1, 1978
6.577
-1.075
-14.05%
jan 1, 1979
5.739
-0.838
-12.74%
jan 1, 1980
4.472
-1.267
-22.08%
jan 1, 1981
4.676
+0.205
4.57%
jan 1, 1982
3.808
-0.868
-18.56%
jan 1, 1983
5.489
+1.681
44.13%
jan 1, 1984
7.217
+1.728
31.48%
jan 1, 1985
6.086
-1.131
-15.67%
jan 1, 1986
7.096
+1.01
16.59%
jan 1, 1987
9.691
+2.595
36.57%
jan 1, 1988
6.4
-3.29
-33.95%
jan 1, 1989
9.68
+3.279
51.23%
jan 1, 1990
8.322
-1.357
-14.02%
jan 1, 1991
7.789
-0.533
-6.41%
jan 1, 1992
7.449
-0.34
-4.36%
jan 1, 1993
6.658
-0.792
-10.63%
jan 1, 1994
4.98
-1.678
-25.2%
jan 1, 1995
4.859
-0.121
-2.43%
jan 1, 1996
5.025
+0.166
3.41%
jan 1, 1997
5.744
+0.719
14.31%
jan 1, 1998
7.142
+1.398
24.34%
jan 1, 1999
6.62
-0.521
-7.3%
jan 1, 2000
5.614
-1.006
-15.2%
jan 1, 2001
5.077
-0.537
-9.57%
jan 1, 2002
4.533
-0.544
-10.71%
jan 1, 2003
4.764
+0.23
5.08%
jan 1, 2004
4.124
-0.64
-13.44%
jan 1, 2005
4.333
+0.21
5.09%
jan 1, 2006
5.132
+0.799
18.44%
jan 1, 2007
5.276
+0.144
2.8%
jan 1, 2008
5.32
+0.044
0.84%
jan 1, 2009
9.793
+4.472
84.06%
jan 1, 2010
7.381
-2.412
-24.63%
jan 1, 2011
8.383
+1.002
13.58%
jan 1, 2012
7.043
-1.34
-15.99%
jan 1, 2013
7.326
+0.283
4.01%
jan 1, 2014
7.535
+0.209
2.86%
jan 1, 2015
8.989
+1.454
19.3%
Ranking of countries by current statistics by years


Comments: