29
/
en
AIzaSyAYiBZKx7MnpbEhh9jyipgxe19OcubqV5w
April 1, 2024
60000
Sub-Saharan Africa (excluding high income)
SSA
false
2
1
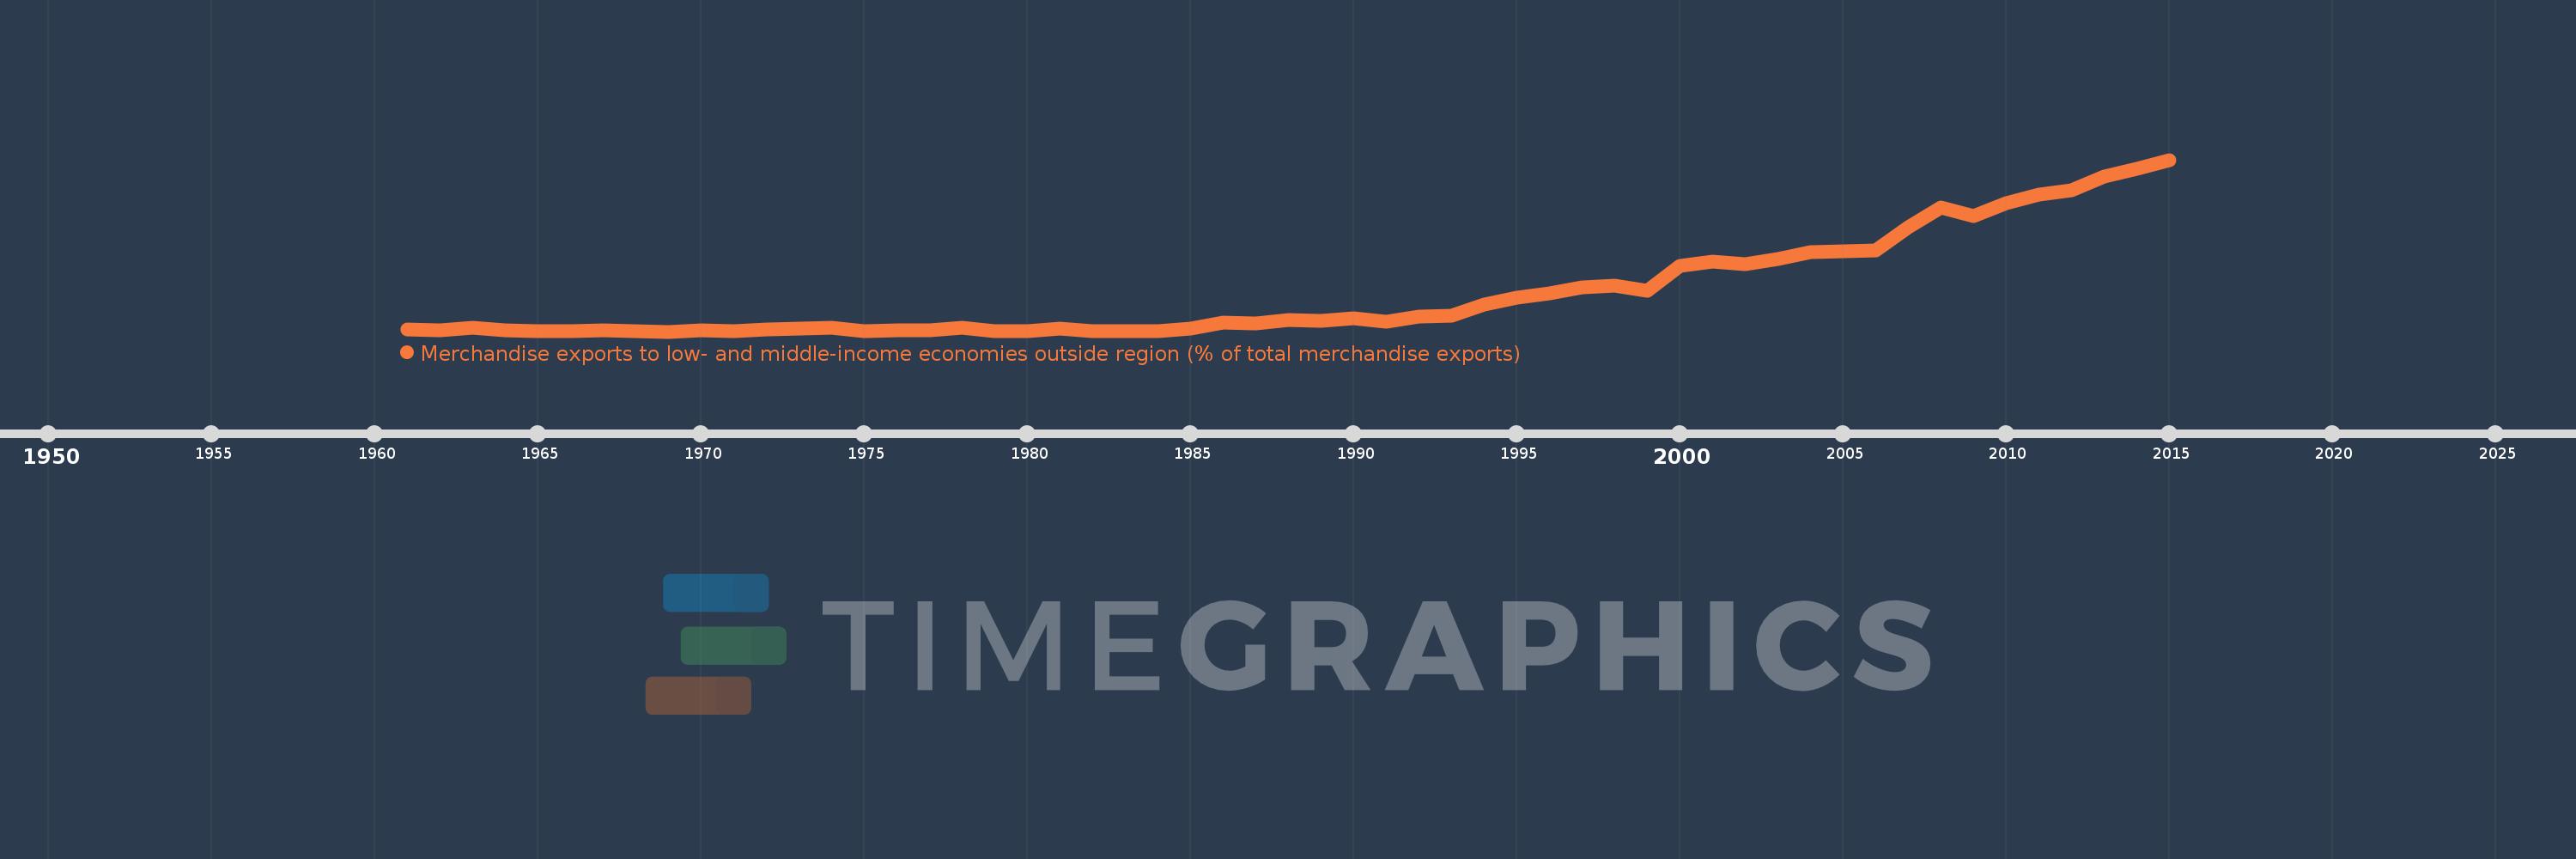
Merchandise exports to low- and middle-income economies outside region (% of total merchandise exports)
2015,2014,2013,2012,2011,2010,2009,2008,2007,2006,2005,2004,2003,2002,2001,2000,1999,1998,1997,1996,1995,1994,1993,1992,1991,1990,1989,1988,1987,1986,1985,1984,1983,1982,1981,1980,1979,1978,1977,1976,1975,1974,1973,1972,1971,1970,1969,1968,1967,1966,1965,1964,1963,1962,1961
This statistics in other country:
AfghanistanAlbaniaAlgeriaAngolaArab WorldArgentinaArmeniaArubaAustraliaAustriaAzerbaijanBahamas, TheBahrainBangladeshBarbadosBelarusBelgiumBelizeBeninBermudaBoliviaBrazilBrunei DarussalamBulgariaBurundiCabo VerdeCambodiaCameroonCanadaCaribbean small statesCentral African RepublicCentral Europe and the BalticsChileChinaColombiaCongo, Dem. Rep.Congo, Rep.Costa RicaCote d'IvoireCroatiaCubaCyprusCzech RepublicDenmarkDominicaDominican RepublicEarly-demographic dividendEast Asia & PacificEast Asia & Pacific (excluding high income)East Asia & Pacific (IDA & IBRD countries)EcuadorEgypt, Arab Rep.El SalvadorEstoniaEthiopiaEuro areaEurope & Central AsiaEurope & Central Asia (excluding high income)Europe & Central Asia (IDA & IBRD countries)European UnionFijiFinlandFragile and conflict affected situationsFranceGabonGambia, TheGeorgiaGermanyGhanaGreeceGreenlandGuatemalaGuineaGuyanaHaitiHeavily indebted poor countries (HIPC)High incomeHondurasHong Kong SAR, ChinaHungaryIBRD onlyIcelandIDA & IBRD totalIDA blendIDA onlyIDA totalIndiaIndonesiaIran, Islamic Rep.IraqIrelandIsraelItalyJamaicaJapanJordanKazakhstanKenyaKorea, Dem. People’s Rep.Korea, Rep.KuwaitLao PDRLate-demographic dividendLatin America & Caribbean Latin America & Caribbean (excluding high income)Latin America & the Caribbean (IDA & IBRD countries)LatviaLeast developed countries: UN classificationLebanonLiberiaLibyaLithuaniaLow & middle incomeLow incomeLower middle incomeLuxembourgMacao SAR, ChinaMacedonia, FYRMadagascarMalawiMalaysiaMaliMaltaMauritaniaMauritiusMexicoMiddle East & North AfricaMiddle East & North Africa (excluding high income)Middle East & North Africa (IDA & IBRD countries)Middle incomeMoldovaMongoliaMontenegroMoroccoMozambiqueMyanmarNetherlandsNew CaledoniaNew ZealandNicaraguaNigerNigeriaNorth AmericaNorwayOECD membersOmanOther small statesPacific island small statesPakistanPanamaPapua New GuineaParaguayPeruPhilippinesPolandPortugalPost-demographic dividendPre-demographic dividendQatarRomaniaRussian FederationRwandaSamoaSaudi ArabiaSenegalSerbiaSeychellesSierra LeoneSingaporeSlovak RepublicSloveniaSmall statesSomaliaSouth AfricaSouth AsiaSouth Asia (IDA & IBRD)SpainSri LankaSt. LuciaSt. Vincent and the GrenadinesSub-Saharan Africa Sub-Saharan Africa (excluding high income)Sub-Saharan Africa (IDA & IBRD countries)SudanSurinameSwedenSwitzerlandSyrian Arab RepublicTanzaniaThailandTogoTrinidad and TobagoTunisiaTurkeyUgandaUkraineUnited Arab EmiratesUnited KingdomUnited StatesUpper middle incomeUruguayVenezuela, RBVietnamWorldYemen, Rep.ZambiaZimbabwe Timeline:
This timeline shows a graph from 1961 to 2015 of Sub-Saharan Africa (excluding high income). No data until 1960. Number of actual observations by date: 55.
Source name:
World Development Indicators
Source organization:
World Bank staff estimates based data from International Monetary Fund's Direction of Trade database.
Categories, topics:
Private Sector, Trade
Last updated:
apr 23, 2017
Indicators value changes by year
Maximum:
31.576
jan 1, 2015
At the date of observation
Value
Absolute change
Change from previous value
jan 1, 1961
1.346
+1.346
0.0%
jan 1, 1962
1.13
-0.216
-16.08%
jan 1, 1963
1.579
+0.449
39.73%
jan 1, 1964
1.151
-0.427
-27.06%
jan 1, 1965
0.947
-0.204
-17.73%
jan 1, 1966
1.027
+0.08
8.46%
jan 1, 1967
1.064
+0.036
3.54%
jan 1, 1968
1.003
-0.061
-5.74%
jan 1, 1969
0.907
-0.095
-9.51%
jan 1, 1970
1.116
+0.209
23.04%
jan 1, 1971
0.94
-0.176
-15.78%
jan 1, 1972
1.29
+0.35
37.17%
jan 1, 1973
1.408
+0.119
9.2%
jan 1, 1974
1.549
+0.141
10.01%
jan 1, 1975
0.914
-0.636
-41.04%
jan 1, 1976
1.066
+0.152
16.62%
jan 1, 1977
1.107
+0.041
3.88%
jan 1, 1978
1.667
+0.56
50.64%
jan 1, 1979
0.987
-0.681
-40.83%
jan 1, 1980
0.922
-0.064
-6.5%
jan 1, 1981
1.422
+0.499
54.15%
jan 1, 1982
1.022
-0.4
-28.14%
jan 1, 1983
0.935
-0.086
-8.46%
jan 1, 1984
0.987
+0.052
5.55%
jan 1, 1985
1.459
+0.472
47.8%
jan 1, 1986
2.566
+1.107
75.85%
jan 1, 1987
2.391
-0.175
-6.81%
jan 1, 1988
2.907
+0.516
21.58%
jan 1, 1989
2.898
-0.009
-0.31%
jan 1, 1990
3.33
+0.432
14.92%
jan 1, 1991
2.71
-0.62
-18.62%
jan 1, 1992
3.55
+0.84
30.99%
jan 1, 1993
3.73
+0.18
5.07%
jan 1, 1994
5.672
+1.942
52.05%
jan 1, 1995
6.958
+1.287
22.69%
jan 1, 1996
7.703
+0.745
10.7%
jan 1, 1997
8.762
+1.058
13.74%
jan 1, 1998
9.16
+0.399
4.55%
jan 1, 1999
8.222
-0.938
-10.24%
jan 1, 2000
12.712
+4.49
54.61%
jan 1, 2001
13.388
+0.676
5.32%
jan 1, 2002
12.879
-0.509
-3.8%
jan 1, 2003
13.88
+1.0
7.77%
jan 1, 2004
15.155
+1.275
9.19%
jan 1, 2005
15.281
+0.127
0.84%
jan 1, 2006
15.334
+0.052
0.34%
jan 1, 2007
19.568
+4.234
27.61%
jan 1, 2008
23.064
+3.496
17.87%
jan 1, 2009
21.579
-1.486
-6.44%
jan 1, 2010
23.878
+2.299
10.66%
jan 1, 2011
25.411
+1.533
6.42%
jan 1, 2012
26.071
+0.66
2.6%
jan 1, 2013
28.52
+2.45
9.4%
jan 1, 2014
30.04
+1.519
5.33%
jan 1, 2015
31.576
+1.536
5.11%
Ranking of countries by current statistics by years


Comments: