29
/
en
AIzaSyAYiBZKx7MnpbEhh9jyipgxe19OcubqV5w
April 1, 2024
30064
Euro area
EMU
false
2
1
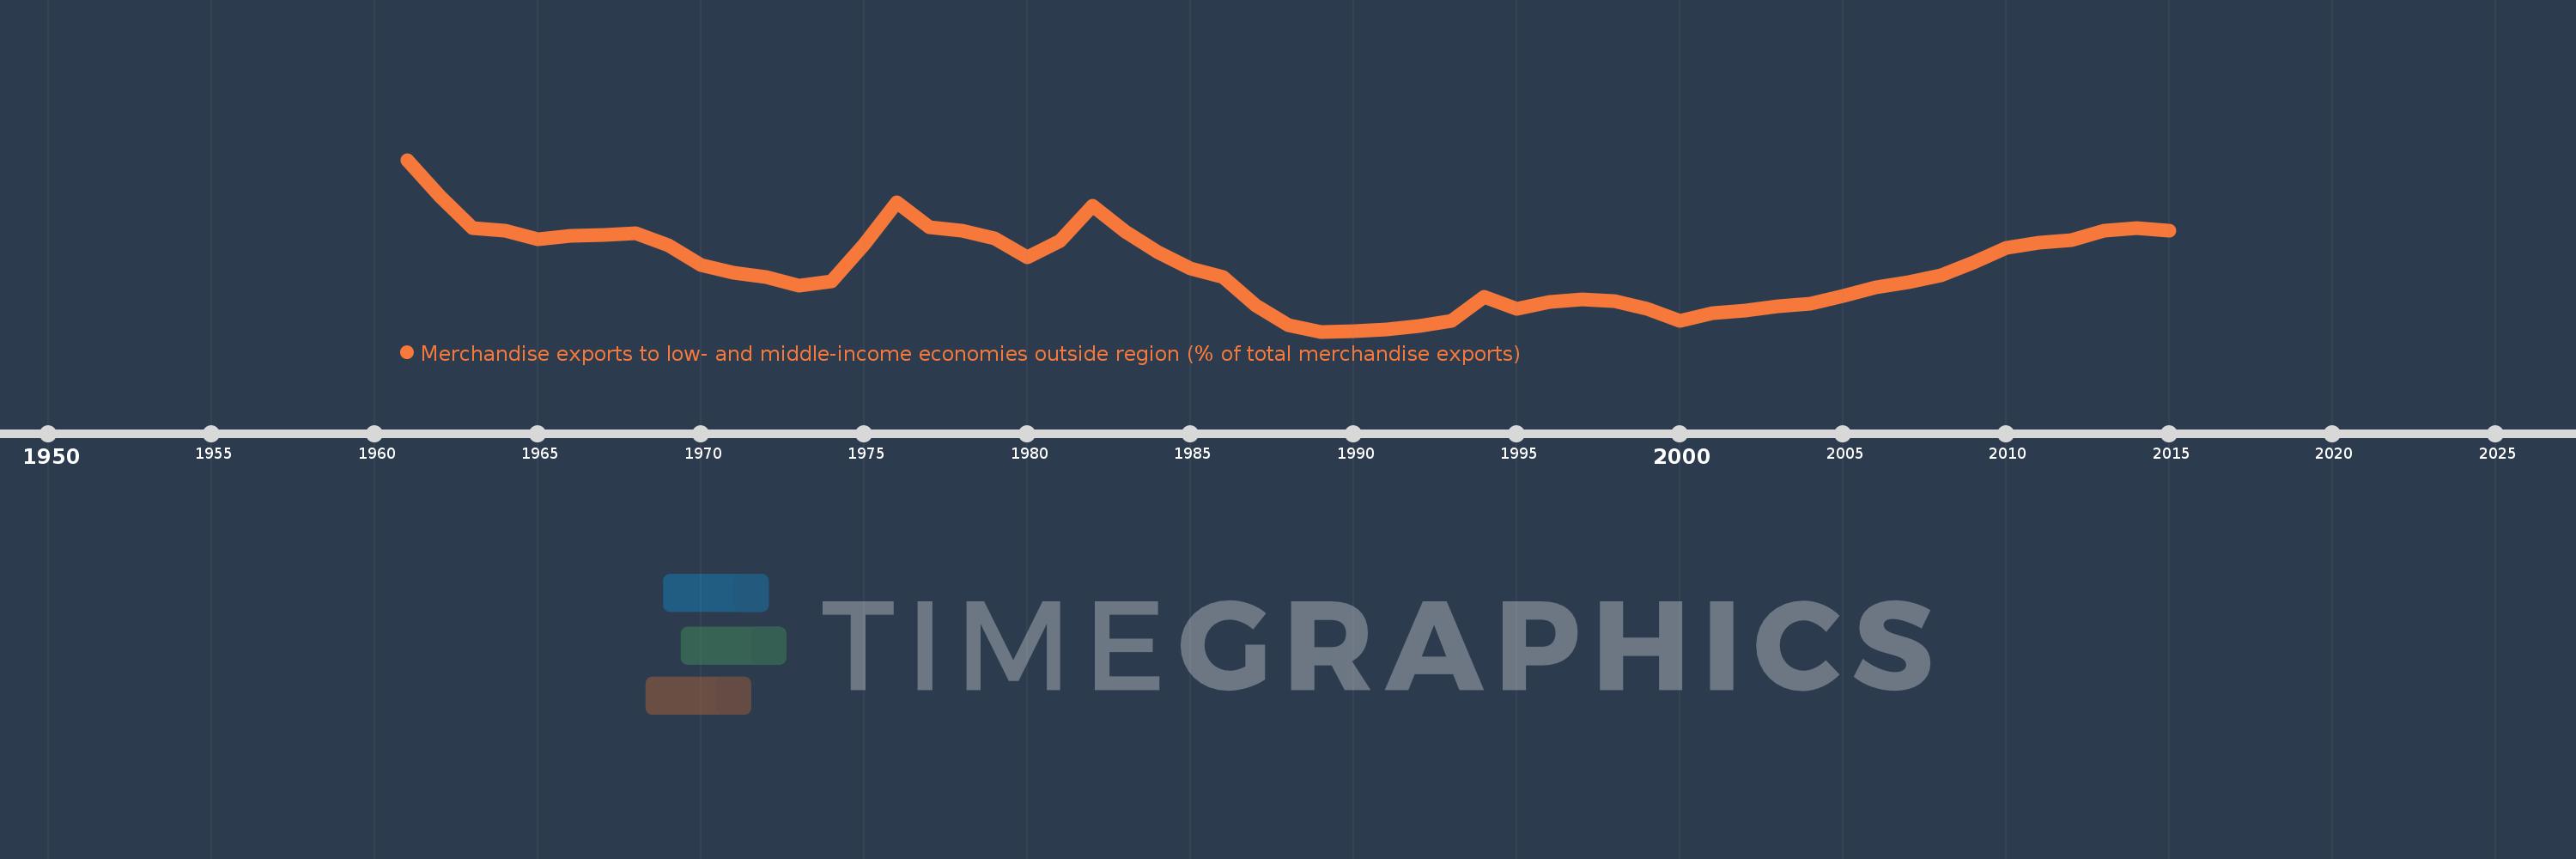
Merchandise exports to low- and middle-income economies outside region (% of total merchandise exports)
2015,2014,2013,2012,2011,2010,2009,2008,2007,2006,2005,2004,2003,2002,2001,2000,1999,1998,1997,1996,1995,1994,1993,1992,1991,1990,1989,1988,1987,1986,1985,1984,1983,1982,1981,1980,1979,1978,1977,1976,1975,1974,1973,1972,1971,1970,1969,1968,1967,1966,1965,1964,1963,1962,1961
This statistics in other country:
AfghanistanAlbaniaAlgeriaAngolaArab WorldArgentinaArmeniaArubaAustraliaAustriaAzerbaijanBahamas, TheBahrainBangladeshBarbadosBelarusBelgiumBelizeBeninBermudaBoliviaBrazilBrunei DarussalamBulgariaBurundiCabo VerdeCambodiaCameroonCanadaCaribbean small statesCentral African RepublicCentral Europe and the BalticsChileChinaColombiaCongo, Dem. Rep.Congo, Rep.Costa RicaCote d'IvoireCroatiaCubaCyprusCzech RepublicDenmarkDominicaDominican RepublicEarly-demographic dividendEast Asia & PacificEast Asia & Pacific (excluding high income)East Asia & Pacific (IDA & IBRD countries)EcuadorEgypt, Arab Rep.El SalvadorEstoniaEthiopiaEuro areaEurope & Central AsiaEurope & Central Asia (excluding high income)Europe & Central Asia (IDA & IBRD countries)European UnionFijiFinlandFragile and conflict affected situationsFranceGabonGambia, TheGeorgiaGermanyGhanaGreeceGreenlandGuatemalaGuineaGuyanaHaitiHeavily indebted poor countries (HIPC)High incomeHondurasHong Kong SAR, ChinaHungaryIBRD onlyIcelandIDA & IBRD totalIDA blendIDA onlyIDA totalIndiaIndonesiaIran, Islamic Rep.IraqIrelandIsraelItalyJamaicaJapanJordanKazakhstanKenyaKorea, Dem. People’s Rep.Korea, Rep.KuwaitLao PDRLate-demographic dividendLatin America & Caribbean Latin America & Caribbean (excluding high income)Latin America & the Caribbean (IDA & IBRD countries)LatviaLeast developed countries: UN classificationLebanonLiberiaLibyaLithuaniaLow & middle incomeLow incomeLower middle incomeLuxembourgMacao SAR, ChinaMacedonia, FYRMadagascarMalawiMalaysiaMaliMaltaMauritaniaMauritiusMexicoMiddle East & North AfricaMiddle East & North Africa (excluding high income)Middle East & North Africa (IDA & IBRD countries)Middle incomeMoldovaMongoliaMontenegroMoroccoMozambiqueMyanmarNetherlandsNew CaledoniaNew ZealandNicaraguaNigerNigeriaNorth AmericaNorwayOECD membersOmanOther small statesPacific island small statesPakistanPanamaPapua New GuineaParaguayPeruPhilippinesPolandPortugalPost-demographic dividendPre-demographic dividendQatarRomaniaRussian FederationRwandaSamoaSaudi ArabiaSenegalSerbiaSeychellesSierra LeoneSingaporeSlovak RepublicSloveniaSmall statesSomaliaSouth AfricaSouth AsiaSouth Asia (IDA & IBRD)SpainSri LankaSt. LuciaSt. Vincent and the GrenadinesSub-Saharan Africa Sub-Saharan Africa (excluding high income)Sub-Saharan Africa (IDA & IBRD countries)SudanSurinameSwedenSwitzerlandSyrian Arab RepublicTanzaniaThailandTogoTrinidad and TobagoTunisiaTurkeyUgandaUkraineUnited Arab EmiratesUnited KingdomUnited StatesUpper middle incomeUruguayVenezuela, RBVietnamWorldYemen, Rep.ZambiaZimbabwe Timeline:
This timeline shows a graph from 1961 to 2015 of Euro area. No data until 1960. Number of actual observations by date: 55.
Source name:
World Development Indicators
Source organization:
World Bank staff estimates based data from International Monetary Fund's Direction of Trade database.
Categories, topics:
Private Sector, Trade
Last updated:
apr 23, 2017
Indicators value changes by year
Maximum:
20.084
jan 1, 1961
At the date of observation
Value
Absolute change
Change from previous value
jan 1, 1961
20.084
+20.084
0.0%
jan 1, 1962
17.667
-2.417
-12.03%
jan 1, 1963
15.536
-2.132
-12.07%
jan 1, 1964
15.376
-0.16
-1.03%
jan 1, 1965
14.785
-0.591
-3.84%
jan 1, 1966
15.004
+0.219
1.48%
jan 1, 1967
15.087
+0.082
0.55%
jan 1, 1968
15.181
+0.094
0.63%
jan 1, 1969
14.411
-0.77
-5.07%
jan 1, 1970
13.092
-1.318
-9.15%
jan 1, 1971
12.548
-0.544
-4.16%
jan 1, 1972
12.263
-0.285
-2.27%
jan 1, 1973
11.685
-0.578
-4.72%
jan 1, 1974
12.006
+0.321
2.75%
jan 1, 1975
14.458
+2.452
20.43%
jan 1, 1976
17.265
+2.807
19.41%
jan 1, 1977
15.608
-1.657
-9.6%
jan 1, 1978
15.381
-0.227
-1.46%
jan 1, 1979
14.842
-0.539
-3.5%
jan 1, 1980
13.597
-1.245
-8.39%
jan 1, 1981
14.661
+1.064
7.82%
jan 1, 1982
17.006
+2.345
15.99%
jan 1, 1983
15.329
-1.677
-9.86%
jan 1, 1984
13.963
-1.366
-8.91%
jan 1, 1985
12.867
-1.095
-7.85%
jan 1, 1986
12.3
-0.567
-4.41%
jan 1, 1987
10.387
-1.913
-15.55%
jan 1, 1988
9.11
-1.278
-12.3%
jan 1, 1989
8.656
-0.453
-4.98%
jan 1, 1990
8.71
+0.054
0.62%
jan 1, 1991
8.812
+0.103
1.18%
jan 1, 1992
9.0
+0.188
2.13%
jan 1, 1993
9.351
+0.351
3.9%
jan 1, 1994
10.976
+1.626
17.39%
jan 1, 1995
10.176
-0.8
-7.29%
jan 1, 1996
10.616
+0.439
4.32%
jan 1, 1997
10.827
+0.211
1.99%
jan 1, 1998
10.687
-0.14
-1.29%
jan 1, 1999
10.179
-0.509
-4.76%
jan 1, 2000
9.397
-0.782
-7.68%
jan 1, 2001
9.861
+0.464
4.94%
jan 1, 2002
10.047
+0.186
1.88%
jan 1, 2003
10.316
+0.269
2.67%
jan 1, 2004
10.513
+0.197
1.91%
jan 1, 2005
11.026
+0.513
4.88%
jan 1, 2006
11.585
+0.559
5.07%
jan 1, 2007
11.935
+0.35
3.03%
jan 1, 2008
12.384
+0.449
3.76%
jan 1, 2009
13.248
+0.864
6.97%
jan 1, 2010
14.222
+0.974
7.35%
jan 1, 2011
14.576
+0.354
2.49%
jan 1, 2012
14.755
+0.179
1.23%
jan 1, 2013
15.368
+0.613
4.15%
jan 1, 2014
15.566
+0.199
1.29%
jan 1, 2015
15.366
-0.201
-1.29%
Ranking of countries by current statistics by years


Comments: