29
/
en
AIzaSyAYiBZKx7MnpbEhh9jyipgxe19OcubqV5w
April 1, 2024
176669
Lebanon
LBN
true
2
1
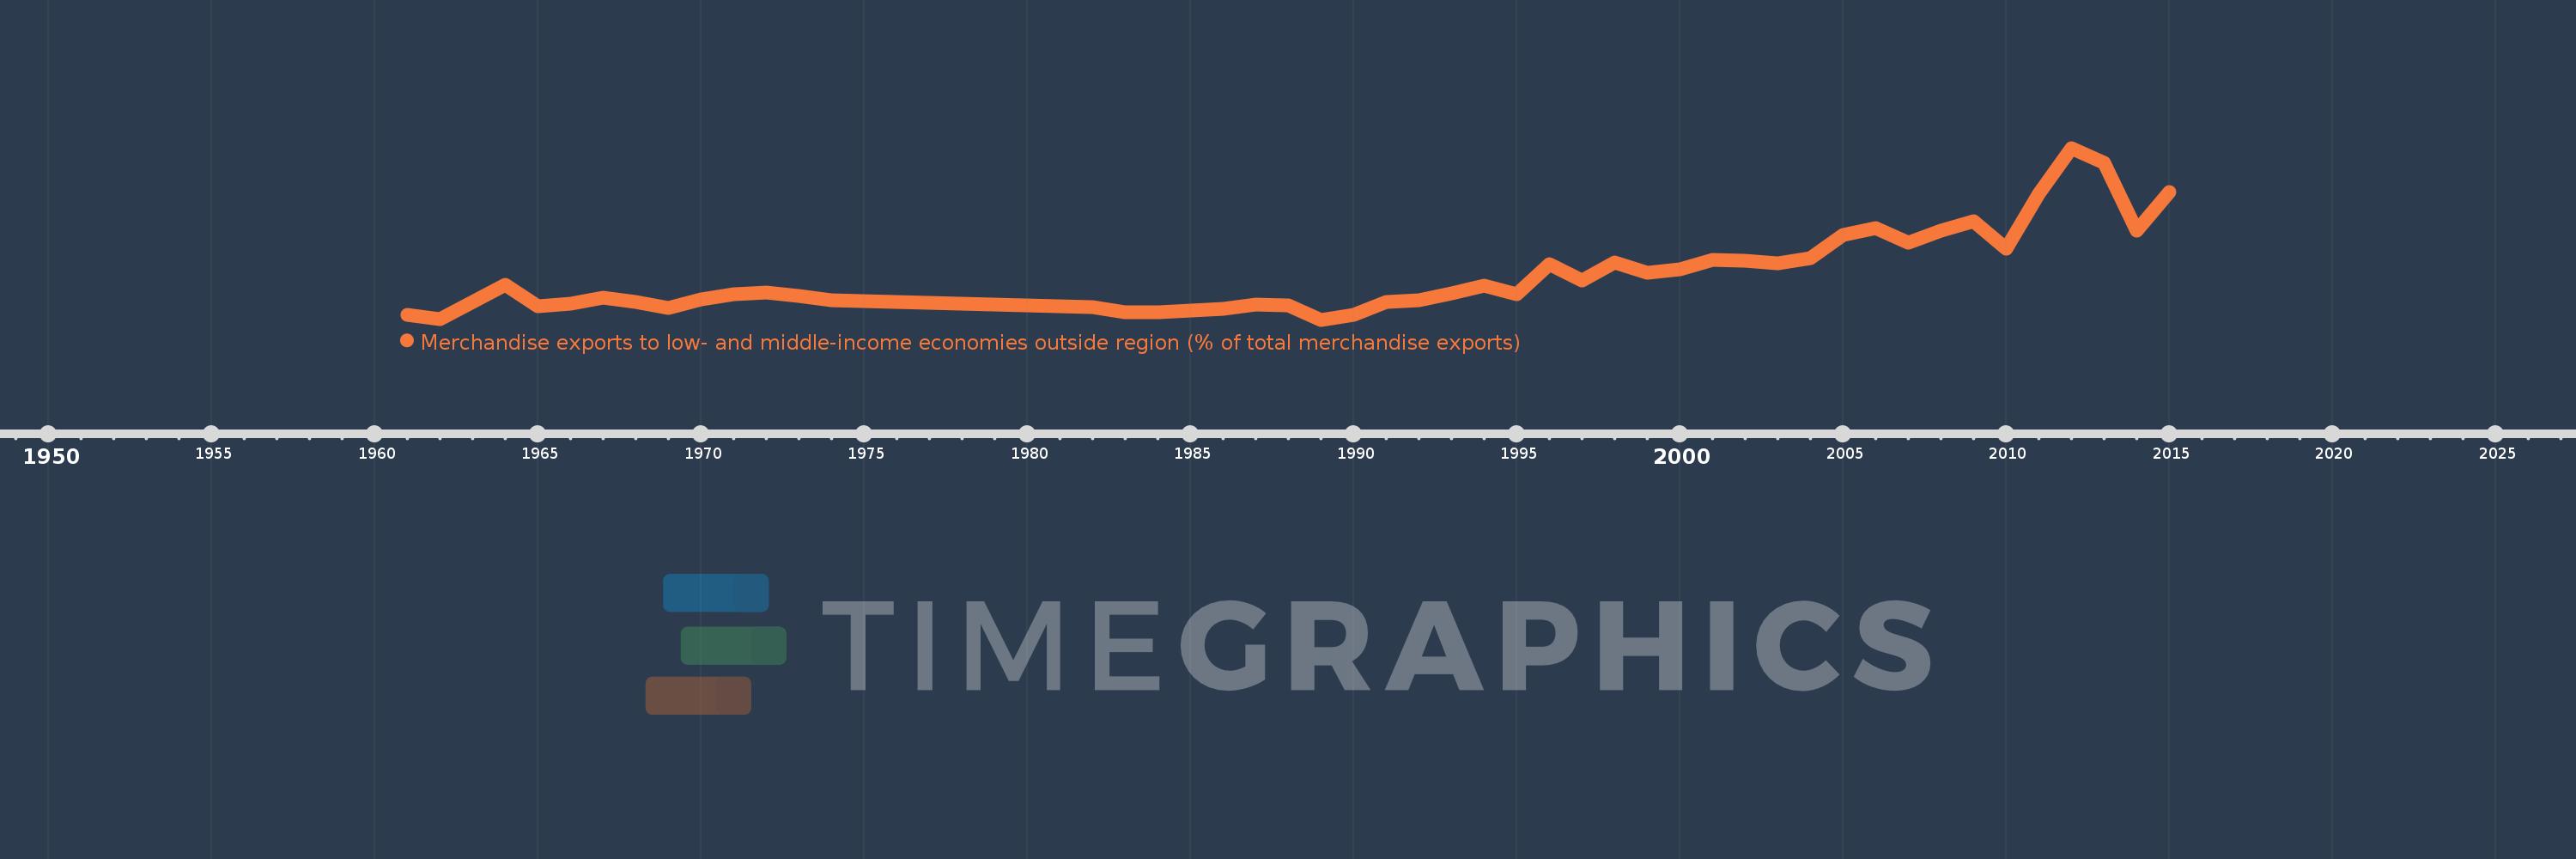
Merchandise exports to low- and middle-income economies outside region (% of total merchandise exports)
2015,2014,2013,2012,2011,2010,2009,2008,2007,2006,2005,2004,2003,2002,2001,2000,1999,1998,1997,1996,1995,1994,1993,1992,1991,1990,1989,1988,1987,1986,1985,1984,1983,1982,1974,1973,1972,1971,1970,1969,1968,1967,1966,1965,1964,1962,1961
This statistics in other country:
AfghanistanAlbaniaAlgeriaAngolaArab WorldArgentinaArmeniaArubaAustraliaAustriaAzerbaijanBahamas, TheBahrainBangladeshBarbadosBelarusBelgiumBelizeBeninBermudaBoliviaBrazilBrunei DarussalamBulgariaBurundiCabo VerdeCambodiaCameroonCanadaCaribbean small statesCentral African RepublicCentral Europe and the BalticsChileChinaColombiaCongo, Dem. Rep.Congo, Rep.Costa RicaCote d'IvoireCroatiaCubaCyprusCzech RepublicDenmarkDominicaDominican RepublicEarly-demographic dividendEast Asia & PacificEast Asia & Pacific (excluding high income)East Asia & Pacific (IDA & IBRD countries)EcuadorEgypt, Arab Rep.El SalvadorEstoniaEthiopiaEuro areaEurope & Central AsiaEurope & Central Asia (excluding high income)Europe & Central Asia (IDA & IBRD countries)European UnionFijiFinlandFragile and conflict affected situationsFranceGabonGambia, TheGeorgiaGermanyGhanaGreeceGreenlandGuatemalaGuineaGuyanaHaitiHeavily indebted poor countries (HIPC)High incomeHondurasHong Kong SAR, ChinaHungaryIBRD onlyIcelandIDA & IBRD totalIDA blendIDA onlyIDA totalIndiaIndonesiaIran, Islamic Rep.IraqIrelandIsraelItalyJamaicaJapanJordanKazakhstanKenyaKorea, Dem. People’s Rep.Korea, Rep.KuwaitLao PDRLate-demographic dividendLatin America & Caribbean Latin America & Caribbean (excluding high income)Latin America & the Caribbean (IDA & IBRD countries)LatviaLeast developed countries: UN classificationLebanonLiberiaLibyaLithuaniaLow & middle incomeLow incomeLower middle incomeLuxembourgMacao SAR, ChinaMacedonia, FYRMadagascarMalawiMalaysiaMaliMaltaMauritaniaMauritiusMexicoMiddle East & North AfricaMiddle East & North Africa (excluding high income)Middle East & North Africa (IDA & IBRD countries)Middle incomeMoldovaMongoliaMontenegroMoroccoMozambiqueMyanmarNetherlandsNew CaledoniaNew ZealandNicaraguaNigerNigeriaNorth AmericaNorwayOECD membersOmanOther small statesPacific island small statesPakistanPanamaPapua New GuineaParaguayPeruPhilippinesPolandPortugalPost-demographic dividendPre-demographic dividendQatarRomaniaRussian FederationRwandaSamoaSaudi ArabiaSenegalSerbiaSeychellesSierra LeoneSingaporeSlovak RepublicSloveniaSmall statesSomaliaSouth AfricaSouth AsiaSouth Asia (IDA & IBRD)SpainSri LankaSt. LuciaSt. Vincent and the GrenadinesSub-Saharan Africa Sub-Saharan Africa (excluding high income)Sub-Saharan Africa (IDA & IBRD countries)SudanSurinameSwedenSwitzerlandSyrian Arab RepublicTanzaniaThailandTogoTrinidad and TobagoTunisiaTurkeyUgandaUkraineUnited Arab EmiratesUnited KingdomUnited StatesUpper middle incomeUruguayVenezuela, RBVietnamWorldYemen, Rep.ZambiaZimbabwe Timeline:
This timeline shows a graph from 1961 to 2015 of Lebanon. No data until 1960. Number of actual observations by date: 47.
Source name:
World Development Indicators
Source organization:
World Bank staff estimates based data from International Monetary Fund's Direction of Trade database.
Categories, topics:
Private Sector, Trade
Last updated:
apr 23, 2017
Indicators value changes by year
Maximum:
36.904
jan 1, 2012
At the date of observation
Value
Absolute change
Change from previous value
jan 1, 1961
2.128
+2.128
0.0%
jan 1, 1962
1.232
-0.896
-42.12%
jan 1, 1964
8.444
+7.212
585.63%
jan 1, 1965
4.018
-4.426
-52.42%
jan 1, 1966
4.44
+0.422
10.51%
jan 1, 1967
5.767
+1.327
29.89%
jan 1, 1968
4.916
-0.851
-14.76%
jan 1, 1969
3.628
-1.288
-26.2%
jan 1, 1970
5.376
+1.748
48.17%
jan 1, 1971
6.407
+1.031
19.18%
jan 1, 1972
6.811
+0.405
6.32%
jan 1, 1973
6.139
-0.672
-9.87%
jan 1, 1974
5.25
-0.889
-14.48%
jan 1, 1982
3.861
-1.389
-26.46%
jan 1, 1983
2.663
-1.198
-31.04%
jan 1, 1984
2.753
+0.091
3.4%
jan 1, 1985
3.069
+0.316
11.47%
jan 1, 1986
3.35
+0.281
9.15%
jan 1, 1987
4.317
+0.967
28.87%
jan 1, 1988
4.115
-0.202
-4.68%
jan 1, 1989
1.17
-2.945
-71.57%
jan 1, 1990
2.175
+1.005
85.92%
jan 1, 1991
4.805
+2.63
120.92%
jan 1, 1992
5.181
+0.376
7.83%
jan 1, 1993
6.614
+1.433
27.67%
jan 1, 1994
8.299
+1.685
25.48%
jan 1, 1995
6.457
-1.842
-22.2%
jan 1, 1996
12.816
+6.359
98.48%
jan 1, 1997
9.378
-3.438
-26.83%
jan 1, 1998
13.169
+3.791
40.42%
jan 1, 1999
10.92
-2.249
-17.08%
jan 1, 2000
11.702
+0.782
7.16%
jan 1, 2001
13.663
+1.961
16.76%
jan 1, 2002
13.506
-0.157
-1.15%
jan 1, 2003
12.995
-0.511
-3.78%
jan 1, 2004
13.933
+0.938
7.22%
jan 1, 2005
18.719
+4.785
34.34%
jan 1, 2006
20.315
+1.596
8.53%
jan 1, 2007
17.178
-3.137
-15.44%
jan 1, 2008
19.713
+2.534
14.75%
jan 1, 2009
21.604
+1.891
9.59%
jan 1, 2010
15.92
-5.684
-26.31%
jan 1, 2011
27.332
+11.413
71.69%
jan 1, 2012
36.904
+9.572
35.02%
jan 1, 2013
33.821
-3.083
-8.35%
jan 1, 2014
19.755
-14.066
-41.59%
jan 1, 2015
27.778
+8.022
40.61%
Ranking of countries by current statistics by years


Comments: