29
/
en
AIzaSyAYiBZKx7MnpbEhh9jyipgxe19OcubqV5w
April 1, 2024
170203
Korea, Rep.
KOR
true
2
1
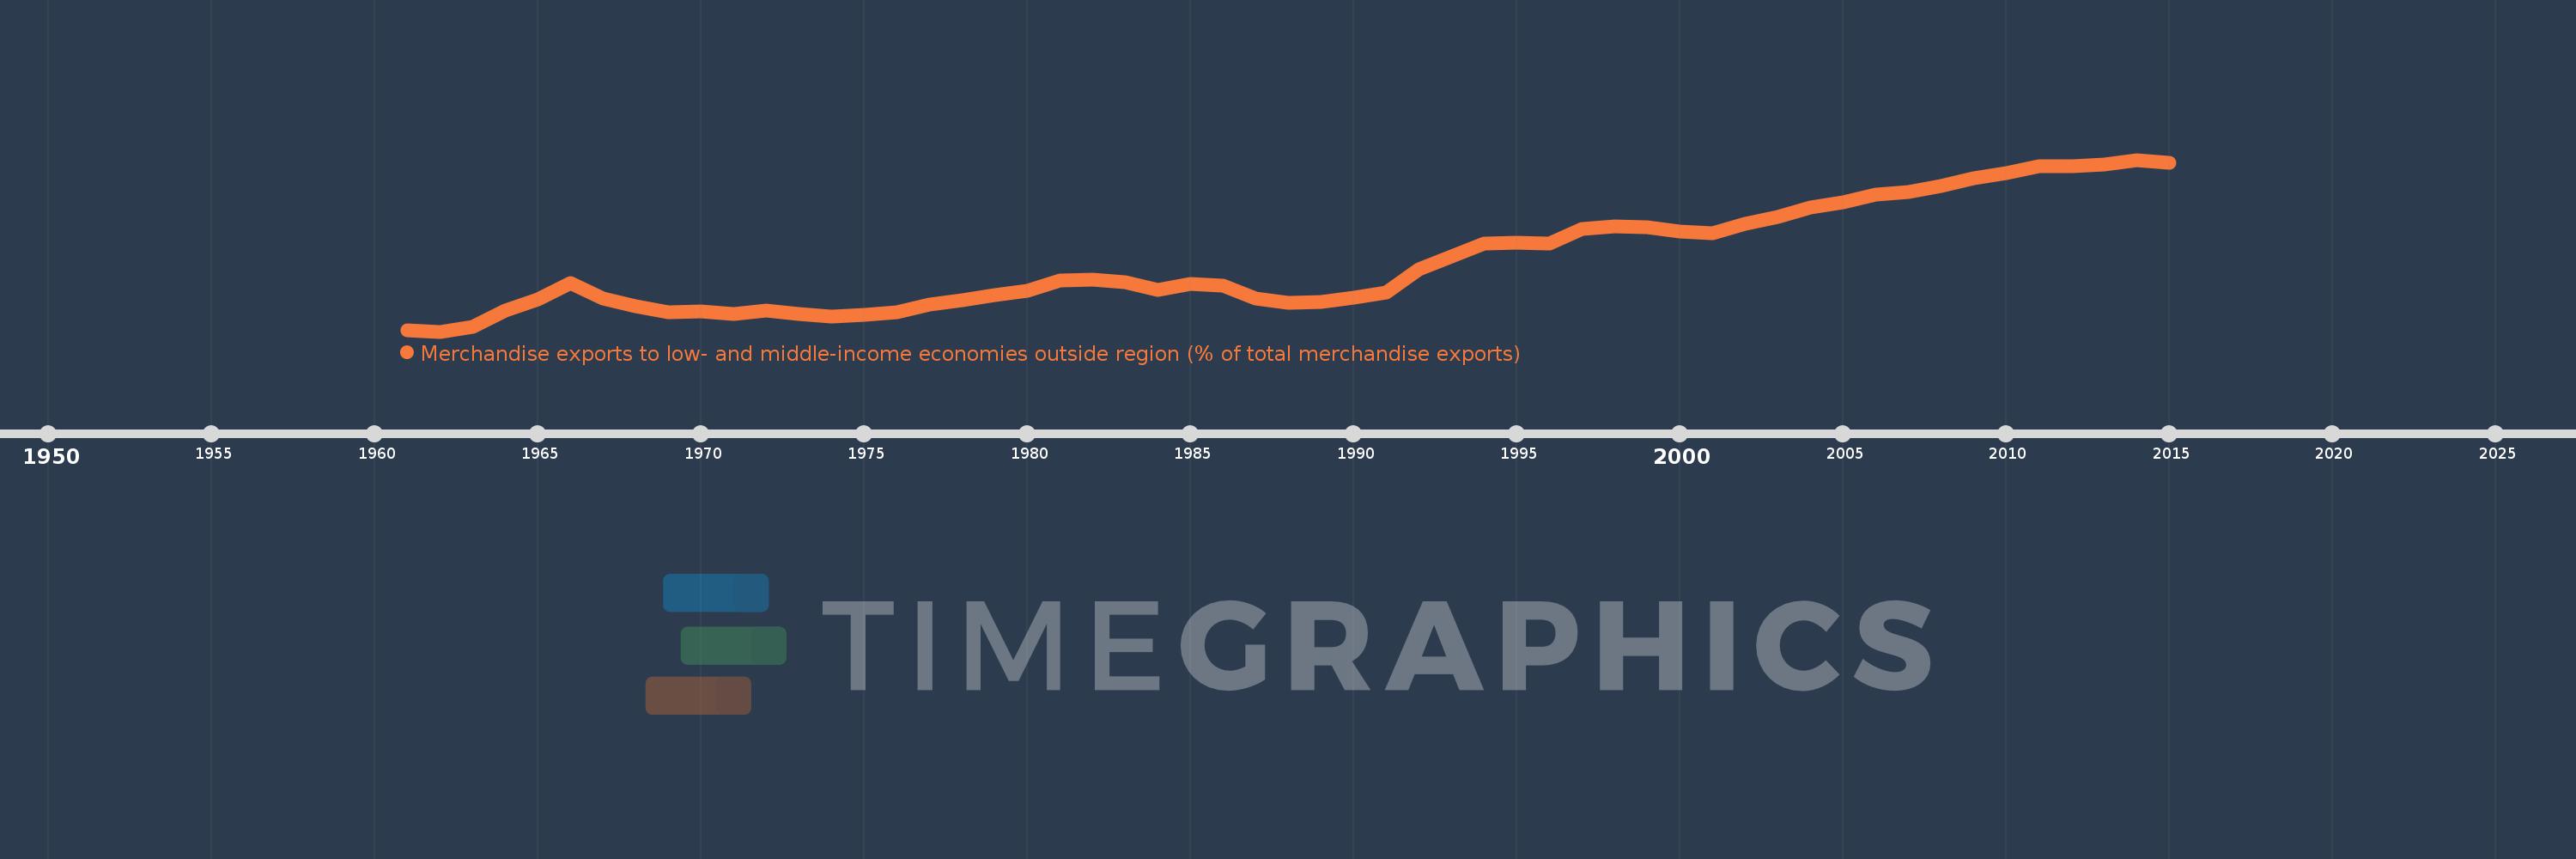
Merchandise exports to low- and middle-income economies outside region (% of total merchandise exports)
2015,2014,2013,2012,2011,2010,2009,2008,2007,2006,2005,2004,2003,2002,2001,2000,1999,1998,1997,1996,1995,1994,1993,1992,1991,1990,1989,1988,1987,1986,1985,1984,1983,1982,1981,1980,1979,1978,1977,1976,1975,1974,1973,1972,1971,1970,1969,1968,1967,1966,1965,1964,1963,1962,1961
This statistics in other country:
AfghanistanAlbaniaAlgeriaAngolaArab WorldArgentinaArmeniaArubaAustraliaAustriaAzerbaijanBahamas, TheBahrainBangladeshBarbadosBelarusBelgiumBelizeBeninBermudaBoliviaBrazilBrunei DarussalamBulgariaBurundiCabo VerdeCambodiaCameroonCanadaCaribbean small statesCentral African RepublicCentral Europe and the BalticsChileChinaColombiaCongo, Dem. Rep.Congo, Rep.Costa RicaCote d'IvoireCroatiaCubaCyprusCzech RepublicDenmarkDominicaDominican RepublicEarly-demographic dividendEast Asia & PacificEast Asia & Pacific (excluding high income)East Asia & Pacific (IDA & IBRD countries)EcuadorEgypt, Arab Rep.El SalvadorEstoniaEthiopiaEuro areaEurope & Central AsiaEurope & Central Asia (excluding high income)Europe & Central Asia (IDA & IBRD countries)European UnionFijiFinlandFragile and conflict affected situationsFranceGabonGambia, TheGeorgiaGermanyGhanaGreeceGreenlandGuatemalaGuineaGuyanaHaitiHeavily indebted poor countries (HIPC)High incomeHondurasHong Kong SAR, ChinaHungaryIBRD onlyIcelandIDA & IBRD totalIDA blendIDA onlyIDA totalIndiaIndonesiaIran, Islamic Rep.IraqIrelandIsraelItalyJamaicaJapanJordanKazakhstanKenyaKorea, Dem. People’s Rep.Korea, Rep.KuwaitLao PDRLate-demographic dividendLatin America & Caribbean Latin America & Caribbean (excluding high income)Latin America & the Caribbean (IDA & IBRD countries)LatviaLeast developed countries: UN classificationLebanonLiberiaLibyaLithuaniaLow & middle incomeLow incomeLower middle incomeLuxembourgMacao SAR, ChinaMacedonia, FYRMadagascarMalawiMalaysiaMaliMaltaMauritaniaMauritiusMexicoMiddle East & North AfricaMiddle East & North Africa (excluding high income)Middle East & North Africa (IDA & IBRD countries)Middle incomeMoldovaMongoliaMontenegroMoroccoMozambiqueMyanmarNetherlandsNew CaledoniaNew ZealandNicaraguaNigerNigeriaNorth AmericaNorwayOECD membersOmanOther small statesPacific island small statesPakistanPanamaPapua New GuineaParaguayPeruPhilippinesPolandPortugalPost-demographic dividendPre-demographic dividendQatarRomaniaRussian FederationRwandaSamoaSaudi ArabiaSenegalSerbiaSeychellesSierra LeoneSingaporeSlovak RepublicSloveniaSmall statesSomaliaSouth AfricaSouth AsiaSouth Asia (IDA & IBRD)SpainSri LankaSt. LuciaSt. Vincent and the GrenadinesSub-Saharan Africa Sub-Saharan Africa (excluding high income)Sub-Saharan Africa (IDA & IBRD countries)SudanSurinameSwedenSwitzerlandSyrian Arab RepublicTanzaniaThailandTogoTrinidad and TobagoTunisiaTurkeyUgandaUkraineUnited Arab EmiratesUnited KingdomUnited StatesUpper middle incomeUruguayVenezuela, RBVietnamWorldYemen, Rep.ZambiaZimbabwe Timeline:
This timeline shows a graph from 1961 to 2015 of Korea, Rep.. No data until 1960. Number of actual observations by date: 55.
Source name:
World Development Indicators
Source organization:
World Bank staff estimates based data from International Monetary Fund's Direction of Trade database.
Categories, topics:
Private Sector, Trade
Last updated:
apr 23, 2017
Indicators value changes by year
Maximum:
50.623
jan 1, 2014
At the date of observation
Value
Absolute change
Change from previous value
jan 1, 1961
0.315
+0.315
0.0%
jan 1, 1962
0.0
-0.315
-100.0%
jan 1, 1964
6.236
+4.965
390.83%
jan 1, 1965
9.536
+3.301
52.93%
jan 1, 1966
14.352
+4.816
50.51%
jan 1, 1967
9.635
-4.718
-32.87%
jan 1, 1968
7.483
-2.152
-22.33%
jan 1, 1969
5.803
-1.679
-22.44%
jan 1, 1970
5.943
+0.139
2.4%
jan 1, 1971
5.119
-0.824
-13.87%
jan 1, 1972
6.287
+1.168
22.83%
jan 1, 1973
5.231
-1.056
-16.79%
jan 1, 1974
4.334
-0.897
-17.15%
jan 1, 1975
4.955
+0.62
14.31%
jan 1, 1976
5.763
+0.809
16.32%
jan 1, 1977
7.862
+2.099
36.41%
jan 1, 1978
9.158
+1.296
16.49%
jan 1, 1979
10.634
+1.476
16.12%
jan 1, 1980
11.898
+1.264
11.88%
jan 1, 1981
14.964
+3.067
25.77%
jan 1, 1982
15.303
+0.338
2.26%
jan 1, 1983
14.607
-0.696
-4.55%
jan 1, 1984
12.194
-2.413
-16.52%
jan 1, 1985
13.934
+1.74
14.27%
jan 1, 1986
13.641
-0.293
-2.1%
jan 1, 1987
9.786
-3.855
-28.26%
jan 1, 1988
8.493
-1.293
-13.21%
jan 1, 1989
8.796
+0.302
3.56%
jan 1, 1990
10.112
+1.316
14.97%
jan 1, 1991
11.556
+1.444
14.28%
jan 1, 1992
18.236
+6.68
57.81%
jan 1, 1993
22.084
+3.848
21.1%
jan 1, 1994
25.818
+3.733
16.9%
jan 1, 1995
26.236
+0.418
1.62%
jan 1, 1996
25.936
-0.299
-1.14%
jan 1, 1997
30.233
+4.297
16.57%
jan 1, 1998
31.033
+0.8
2.65%
jan 1, 1999
30.661
-0.372
-1.2%
jan 1, 2000
29.366
-1.295
-4.22%
jan 1, 2001
28.977
-0.389
-1.32%
jan 1, 2002
31.796
+2.819
9.73%
jan 1, 2003
33.737
+1.941
6.1%
jan 1, 2004
36.608
+2.871
8.51%
jan 1, 2005
38.008
+1.4
3.82%
jan 1, 2006
40.362
+2.354
6.19%
jan 1, 2007
41.069
+0.707
1.75%
jan 1, 2008
42.873
+1.804
4.39%
jan 1, 2009
45.109
+2.236
5.22%
jan 1, 2010
46.675
+1.566
3.47%
jan 1, 2011
48.684
+2.009
4.3%
jan 1, 2012
48.616
-0.068
-0.14%
jan 1, 2013
49.117
+0.501
1.03%
jan 1, 2014
50.623
+1.506
3.07%
jan 1, 2015
49.803
-0.82
-1.62%
Ranking of countries by current statistics by years


Comments: