29
/
en
AIzaSyAYiBZKx7MnpbEhh9jyipgxe19OcubqV5w
April 1, 2024
194516
Mauritius
MUS
true
2
1
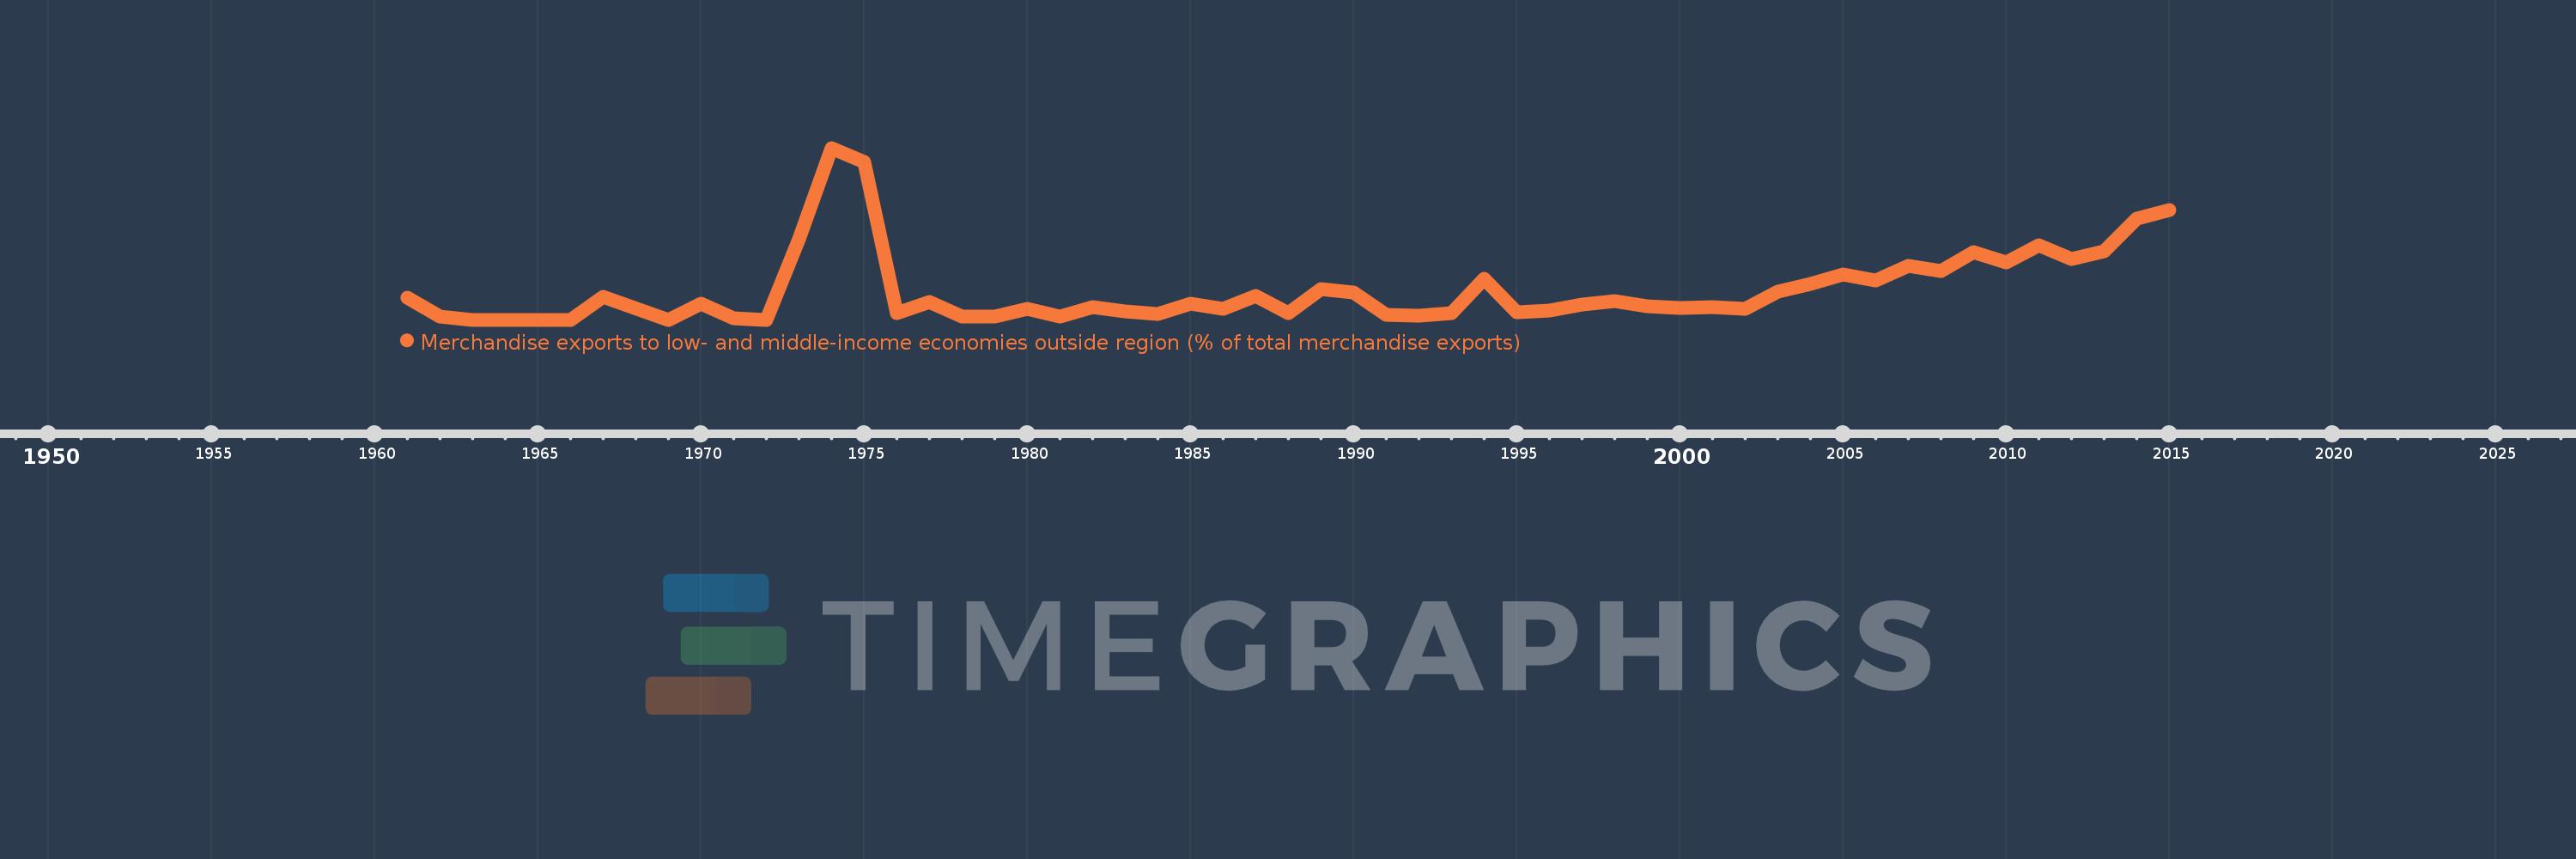
Merchandise exports to low- and middle-income economies outside region (% of total merchandise exports)
2015,2014,2013,2012,2011,2010,2009,2008,2007,2006,2005,2004,2003,2002,2001,2000,1999,1998,1997,1996,1995,1994,1993,1992,1991,1990,1989,1988,1987,1986,1985,1984,1983,1982,1981,1980,1979,1978,1977,1976,1975,1974,1973,1972,1971,1970,1969,1967,1966,1965,1964,1963,1962,1961
This statistics in other country:
AfghanistanAlbaniaAlgeriaAngolaArab WorldArgentinaArmeniaArubaAustraliaAustriaAzerbaijanBahamas, TheBahrainBangladeshBarbadosBelarusBelgiumBelizeBeninBermudaBoliviaBrazilBrunei DarussalamBulgariaBurundiCabo VerdeCambodiaCameroonCanadaCaribbean small statesCentral African RepublicCentral Europe and the BalticsChileChinaColombiaCongo, Dem. Rep.Congo, Rep.Costa RicaCote d'IvoireCroatiaCubaCyprusCzech RepublicDenmarkDominicaDominican RepublicEarly-demographic dividendEast Asia & PacificEast Asia & Pacific (excluding high income)East Asia & Pacific (IDA & IBRD countries)EcuadorEgypt, Arab Rep.El SalvadorEstoniaEthiopiaEuro areaEurope & Central AsiaEurope & Central Asia (excluding high income)Europe & Central Asia (IDA & IBRD countries)European UnionFijiFinlandFragile and conflict affected situationsFranceGabonGambia, TheGeorgiaGermanyGhanaGreeceGreenlandGuatemalaGuineaGuyanaHaitiHeavily indebted poor countries (HIPC)High incomeHondurasHong Kong SAR, ChinaHungaryIBRD onlyIcelandIDA & IBRD totalIDA blendIDA onlyIDA totalIndiaIndonesiaIran, Islamic Rep.IraqIrelandIsraelItalyJamaicaJapanJordanKazakhstanKenyaKorea, Dem. People’s Rep.Korea, Rep.KuwaitLao PDRLate-demographic dividendLatin America & Caribbean Latin America & Caribbean (excluding high income)Latin America & the Caribbean (IDA & IBRD countries)LatviaLeast developed countries: UN classificationLebanonLiberiaLibyaLithuaniaLow & middle incomeLow incomeLower middle incomeLuxembourgMacao SAR, ChinaMacedonia, FYRMadagascarMalawiMalaysiaMaliMaltaMauritaniaMauritiusMexicoMiddle East & North AfricaMiddle East & North Africa (excluding high income)Middle East & North Africa (IDA & IBRD countries)Middle incomeMoldovaMongoliaMontenegroMoroccoMozambiqueMyanmarNetherlandsNew CaledoniaNew ZealandNicaraguaNigerNigeriaNorth AmericaNorwayOECD membersOmanOther small statesPacific island small statesPakistanPanamaPapua New GuineaParaguayPeruPhilippinesPolandPortugalPost-demographic dividendPre-demographic dividendQatarRomaniaRussian FederationRwandaSamoaSaudi ArabiaSenegalSerbiaSeychellesSierra LeoneSingaporeSlovak RepublicSloveniaSmall statesSomaliaSouth AfricaSouth AsiaSouth Asia (IDA & IBRD)SpainSri LankaSt. LuciaSt. Vincent and the GrenadinesSub-Saharan Africa Sub-Saharan Africa (excluding high income)Sub-Saharan Africa (IDA & IBRD countries)SudanSurinameSwedenSwitzerlandSyrian Arab RepublicTanzaniaThailandTogoTrinidad and TobagoTunisiaTurkeyUgandaUkraineUnited Arab EmiratesUnited KingdomUnited StatesUpper middle incomeUruguayVenezuela, RBVietnamWorldYemen, Rep.ZambiaZimbabwe Timeline:
This timeline shows a graph from 1961 to 2015 of Mauritius. No data until 1960. Number of actual observations by date: 54.
Source name:
World Development Indicators
Source organization:
World Bank staff estimates based data from International Monetary Fund's Direction of Trade database.
Categories, topics:
Private Sector, Trade
Last updated:
apr 23, 2017
Indicators value changes by year
Maximum:
10.126
jan 1, 1974
At the date of observation
Value
Absolute change
Change from previous value
jan 1, 1961
1.289
+1.289
0.0%
jan 1, 1962
0.166
-1.123
-87.15%
jan 1, 1963
0.0
-0.166
-100.0%
jan 1, 1967
1.366
+1.366
%
jan 1, 1969
0.0
-1.366
-100.0%
jan 1, 1970
0.952
+0.952
%
jan 1, 1971
0.068
-0.884
-92.89%
jan 1, 1972
0.003
-0.065
-95.62%
jan 1, 1973
4.755
+4.752
160.23K%
jan 1, 1974
10.126
+5.371
112.95%
jan 1, 1975
9.281
-0.846
-8.35%
jan 1, 1976
0.4
-8.881
-95.69%
jan 1, 1977
1.054
+0.654
163.53%
jan 1, 1978
0.207
-0.848
-80.4%
jan 1, 1979
0.206
-0.001
-0.3%
jan 1, 1980
0.656
+0.45
218.61%
jan 1, 1981
0.175
-0.481
-73.27%
jan 1, 1982
0.761
+0.585
333.65%
jan 1, 1983
0.466
-0.295
-38.76%
jan 1, 1984
0.328
-0.138
-29.53%
jan 1, 1985
0.954
+0.626
190.57%
jan 1, 1986
0.666
-0.288
-30.14%
jan 1, 1987
1.4
+0.734
110.11%
jan 1, 1988
0.367
-1.033
-73.8%
jan 1, 1989
1.829
+1.462
398.48%
jan 1, 1990
1.601
-0.227
-12.43%
jan 1, 1991
0.308
-1.293
-80.74%
jan 1, 1992
0.224
-0.085
-27.49%
jan 1, 1993
0.394
+0.17
76.24%
jan 1, 1994
2.421
+2.027
514.37%
jan 1, 1995
0.445
-1.977
-81.63%
jan 1, 1996
0.556
+0.111
25.0%
jan 1, 1997
0.892
+0.337
60.54%
jan 1, 1998
1.104
+0.211
23.67%
jan 1, 1999
0.795
-0.308
-27.93%
jan 1, 2000
0.685
-0.111
-13.91%
jan 1, 2001
0.747
+0.062
9.04%
jan 1, 2002
0.667
-0.08
-10.71%
jan 1, 2003
1.666
+1.0
149.93%
jan 1, 2004
2.104
+0.438
26.28%
jan 1, 2005
2.655
+0.55
26.16%
jan 1, 2006
2.329
-0.326
-12.26%
jan 1, 2007
3.164
+0.835
35.83%
jan 1, 2008
2.876
-0.287
-9.09%
jan 1, 2009
3.97
+1.094
38.03%
jan 1, 2010
3.369
-0.601
-15.14%
jan 1, 2011
4.369
+1.0
29.68%
jan 1, 2012
3.575
-0.794
-18.17%
jan 1, 2013
4.021
+0.446
12.47%
jan 1, 2014
5.94
+1.919
47.72%
jan 1, 2015
6.478
+0.538
9.06%
Ranking of countries by current statistics by years


Comments: