29
/
en
AIzaSyAYiBZKx7MnpbEhh9jyipgxe19OcubqV5w
April 1, 2024
159667
Ireland
IRL
true
2
1
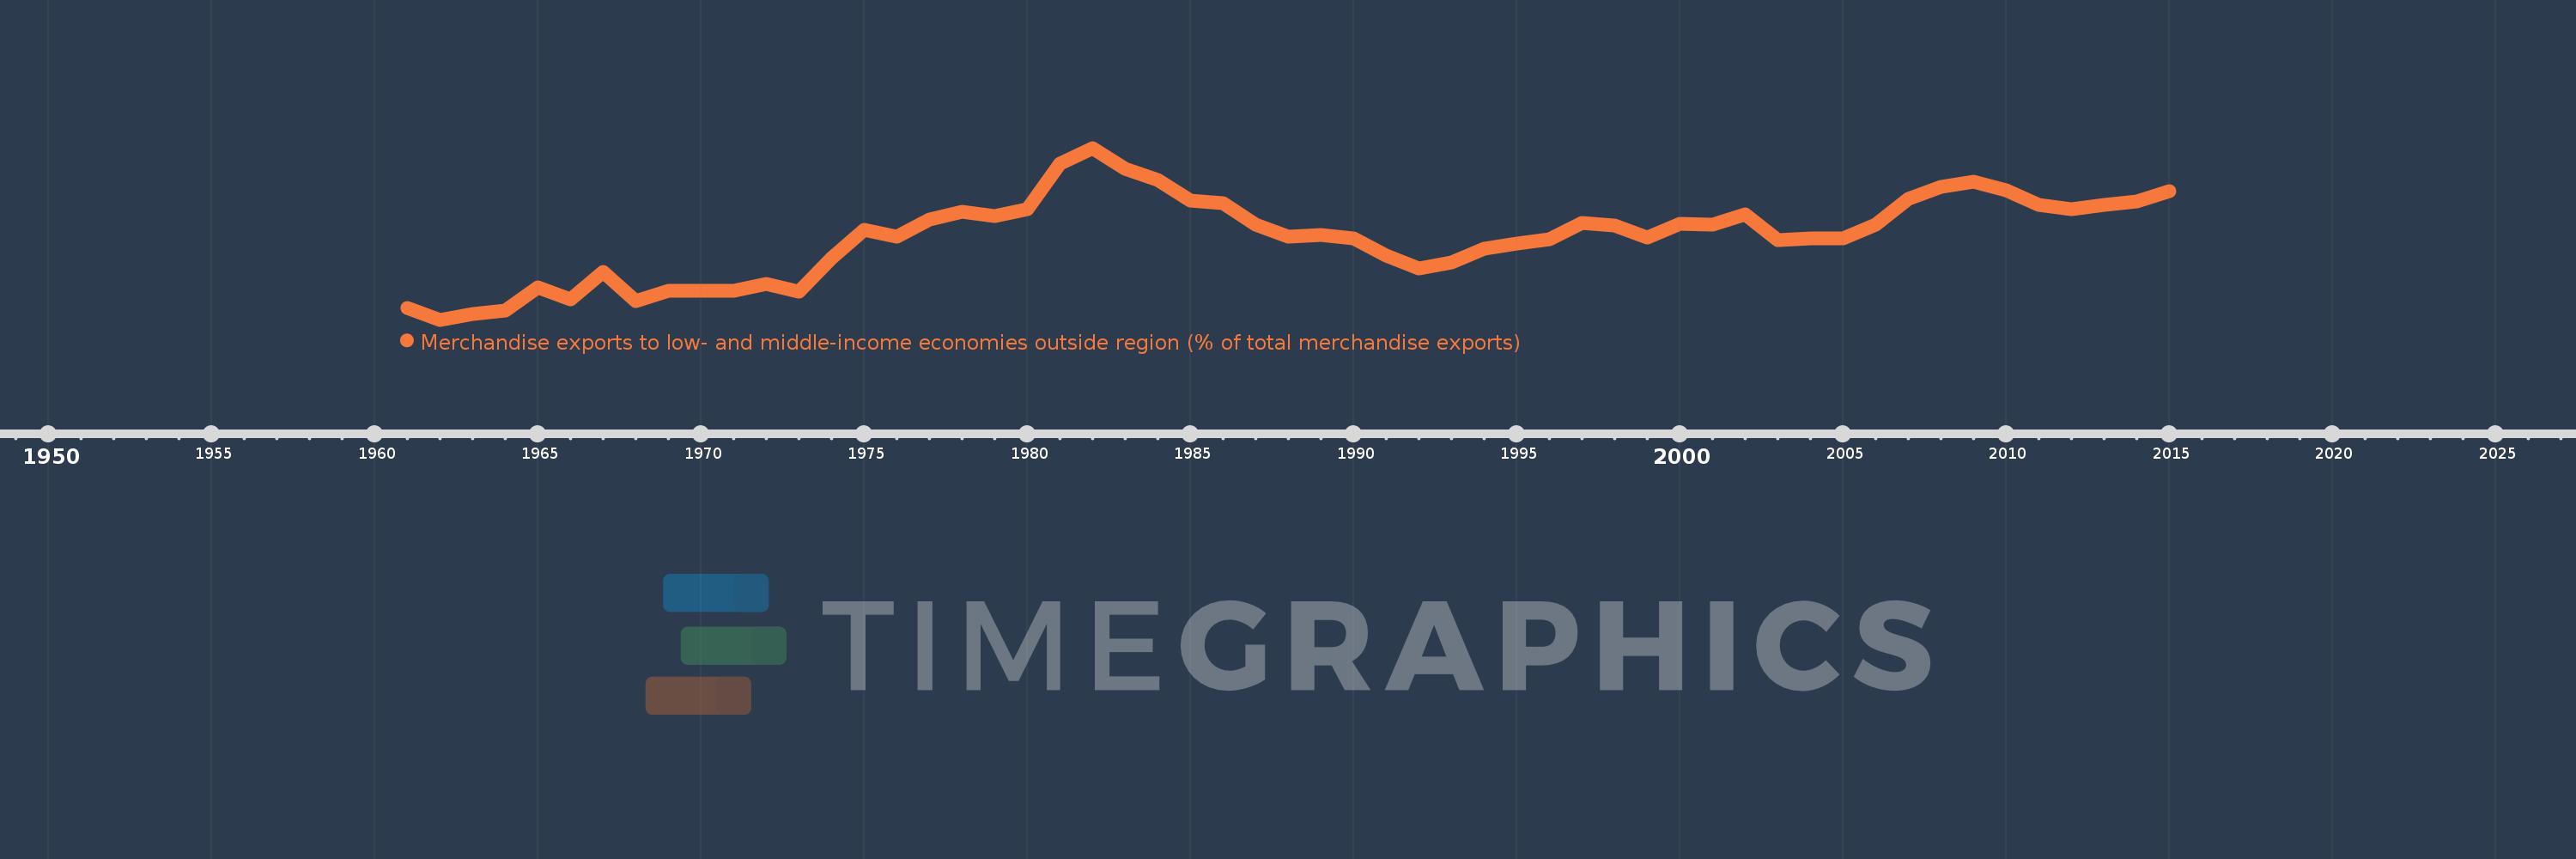
Merchandise exports to low- and middle-income economies outside region (% of total merchandise exports)
2015,2014,2013,2012,2011,2010,2009,2008,2007,2006,2005,2004,2003,2002,2001,2000,1999,1998,1997,1996,1995,1994,1993,1992,1991,1990,1989,1988,1987,1986,1985,1984,1983,1982,1981,1980,1979,1978,1977,1976,1975,1974,1973,1972,1971,1970,1969,1968,1967,1966,1965,1964,1963,1962,1961
This statistics in other country:
AfghanistanAlbaniaAlgeriaAngolaArab WorldArgentinaArmeniaArubaAustraliaAustriaAzerbaijanBahamas, TheBahrainBangladeshBarbadosBelarusBelgiumBelizeBeninBermudaBoliviaBrazilBrunei DarussalamBulgariaBurundiCabo VerdeCambodiaCameroonCanadaCaribbean small statesCentral African RepublicCentral Europe and the BalticsChileChinaColombiaCongo, Dem. Rep.Congo, Rep.Costa RicaCote d'IvoireCroatiaCubaCyprusCzech RepublicDenmarkDominicaDominican RepublicEarly-demographic dividendEast Asia & PacificEast Asia & Pacific (excluding high income)East Asia & Pacific (IDA & IBRD countries)EcuadorEgypt, Arab Rep.El SalvadorEstoniaEthiopiaEuro areaEurope & Central AsiaEurope & Central Asia (excluding high income)Europe & Central Asia (IDA & IBRD countries)European UnionFijiFinlandFragile and conflict affected situationsFranceGabonGambia, TheGeorgiaGermanyGhanaGreeceGreenlandGuatemalaGuineaGuyanaHaitiHeavily indebted poor countries (HIPC)High incomeHondurasHong Kong SAR, ChinaHungaryIBRD onlyIcelandIDA & IBRD totalIDA blendIDA onlyIDA totalIndiaIndonesiaIran, Islamic Rep.IraqIrelandIsraelItalyJamaicaJapanJordanKazakhstanKenyaKorea, Dem. People’s Rep.Korea, Rep.KuwaitLao PDRLate-demographic dividendLatin America & Caribbean Latin America & Caribbean (excluding high income)Latin America & the Caribbean (IDA & IBRD countries)LatviaLeast developed countries: UN classificationLebanonLiberiaLibyaLithuaniaLow & middle incomeLow incomeLower middle incomeLuxembourgMacao SAR, ChinaMacedonia, FYRMadagascarMalawiMalaysiaMaliMaltaMauritaniaMauritiusMexicoMiddle East & North AfricaMiddle East & North Africa (excluding high income)Middle East & North Africa (IDA & IBRD countries)Middle incomeMoldovaMongoliaMontenegroMoroccoMozambiqueMyanmarNetherlandsNew CaledoniaNew ZealandNicaraguaNigerNigeriaNorth AmericaNorwayOECD membersOmanOther small statesPacific island small statesPakistanPanamaPapua New GuineaParaguayPeruPhilippinesPolandPortugalPost-demographic dividendPre-demographic dividendQatarRomaniaRussian FederationRwandaSamoaSaudi ArabiaSenegalSerbiaSeychellesSierra LeoneSingaporeSlovak RepublicSloveniaSmall statesSomaliaSouth AfricaSouth AsiaSouth Asia (IDA & IBRD)SpainSri LankaSt. LuciaSt. Vincent and the GrenadinesSub-Saharan Africa Sub-Saharan Africa (excluding high income)Sub-Saharan Africa (IDA & IBRD countries)SudanSurinameSwedenSwitzerlandSyrian Arab RepublicTanzaniaThailandTogoTrinidad and TobagoTunisiaTurkeyUgandaUkraineUnited Arab EmiratesUnited KingdomUnited StatesUpper middle incomeUruguayVenezuela, RBVietnamWorldYemen, Rep.ZambiaZimbabwe Timeline:
This timeline shows a graph from 1961 to 2015 of Ireland. No data until 1960. Number of actual observations by date: 55.
Source name:
World Development Indicators
Source organization:
World Bank staff estimates based data from International Monetary Fund's Direction of Trade database.
Categories, topics:
Private Sector, Trade
Last updated:
apr 23, 2017
Indicators value changes by year
At the date of observation
Value
Absolute change
Change from previous value
jan 1, 1961
1.199
+1.199
0.0%
jan 1, 1962
0.655
-0.545
-45.42%
jan 1, 1963
0.925
+0.27
41.3%
jan 1, 1964
1.113
+0.188
20.32%
jan 1, 1965
2.188
+1.075
96.62%
jan 1, 1966
1.63
-0.558
-25.5%
jan 1, 1967
2.964
+1.334
81.82%
jan 1, 1968
1.567
-1.396
-47.11%
jan 1, 1969
2.057
+0.49
31.24%
jan 1, 1970
2.056
-0.001
-0.04%
jan 1, 1971
2.053
-0.003
-0.16%
jan 1, 1972
2.388
+0.335
16.33%
jan 1, 1973
2.011
-0.377
-15.78%
jan 1, 1974
3.583
+1.571
78.12%
jan 1, 1975
4.949
+1.366
38.13%
jan 1, 1976
4.62
-0.329
-6.64%
jan 1, 1977
5.459
+0.839
18.15%
jan 1, 1978
5.818
+0.359
6.58%
jan 1, 1979
5.63
-0.189
-3.24%
jan 1, 1980
5.939
+0.309
5.5%
jan 1, 1981
8.119
+2.18
36.71%
jan 1, 1982
8.876
+0.757
9.32%
jan 1, 1983
7.859
-1.017
-11.46%
jan 1, 1984
7.346
-0.513
-6.52%
jan 1, 1985
6.376
-0.97
-13.21%
jan 1, 1986
6.23
-0.146
-2.29%
jan 1, 1987
5.188
-1.042
-16.72%
jan 1, 1988
4.638
-0.55
-10.6%
jan 1, 1989
4.732
+0.094
2.03%
jan 1, 1990
4.551
-0.181
-3.82%
jan 1, 1991
3.731
-0.821
-18.03%
jan 1, 1992
3.126
-0.605
-16.21%
jan 1, 1993
3.378
+0.252
8.05%
jan 1, 1994
4.035
+0.658
19.47%
jan 1, 1995
4.286
+0.251
6.22%
jan 1, 1996
4.494
+0.208
4.85%
jan 1, 1997
5.267
+0.774
17.21%
jan 1, 1998
5.163
-0.104
-1.97%
jan 1, 1999
4.576
-0.587
-11.37%
jan 1, 2000
5.237
+0.661
14.44%
jan 1, 2001
5.216
-0.021
-0.4%
jan 1, 2002
5.684
+0.468
8.97%
jan 1, 2003
4.48
-1.204
-21.18%
jan 1, 2004
4.556
+0.076
1.69%
jan 1, 2005
4.561
+0.005
0.11%
jan 1, 2006
5.187
+0.626
13.73%
jan 1, 2007
6.418
+1.231
23.73%
jan 1, 2008
7.026
+0.609
9.48%
jan 1, 2009
7.269
+0.243
3.46%
jan 1, 2010
6.843
-0.426
-5.87%
jan 1, 2011
6.145
-0.698
-10.2%
jan 1, 2012
5.952
-0.194
-3.15%
jan 1, 2013
6.159
+0.208
3.49%
jan 1, 2014
6.326
+0.167
2.71%
jan 1, 2015
6.794
+0.468
7.4%
Ranking of countries by current statistics by years


Comments: