29
/
en
AIzaSyAYiBZKx7MnpbEhh9jyipgxe19OcubqV5w
April 1, 2024
191649
Malta
MLT
true
2
1
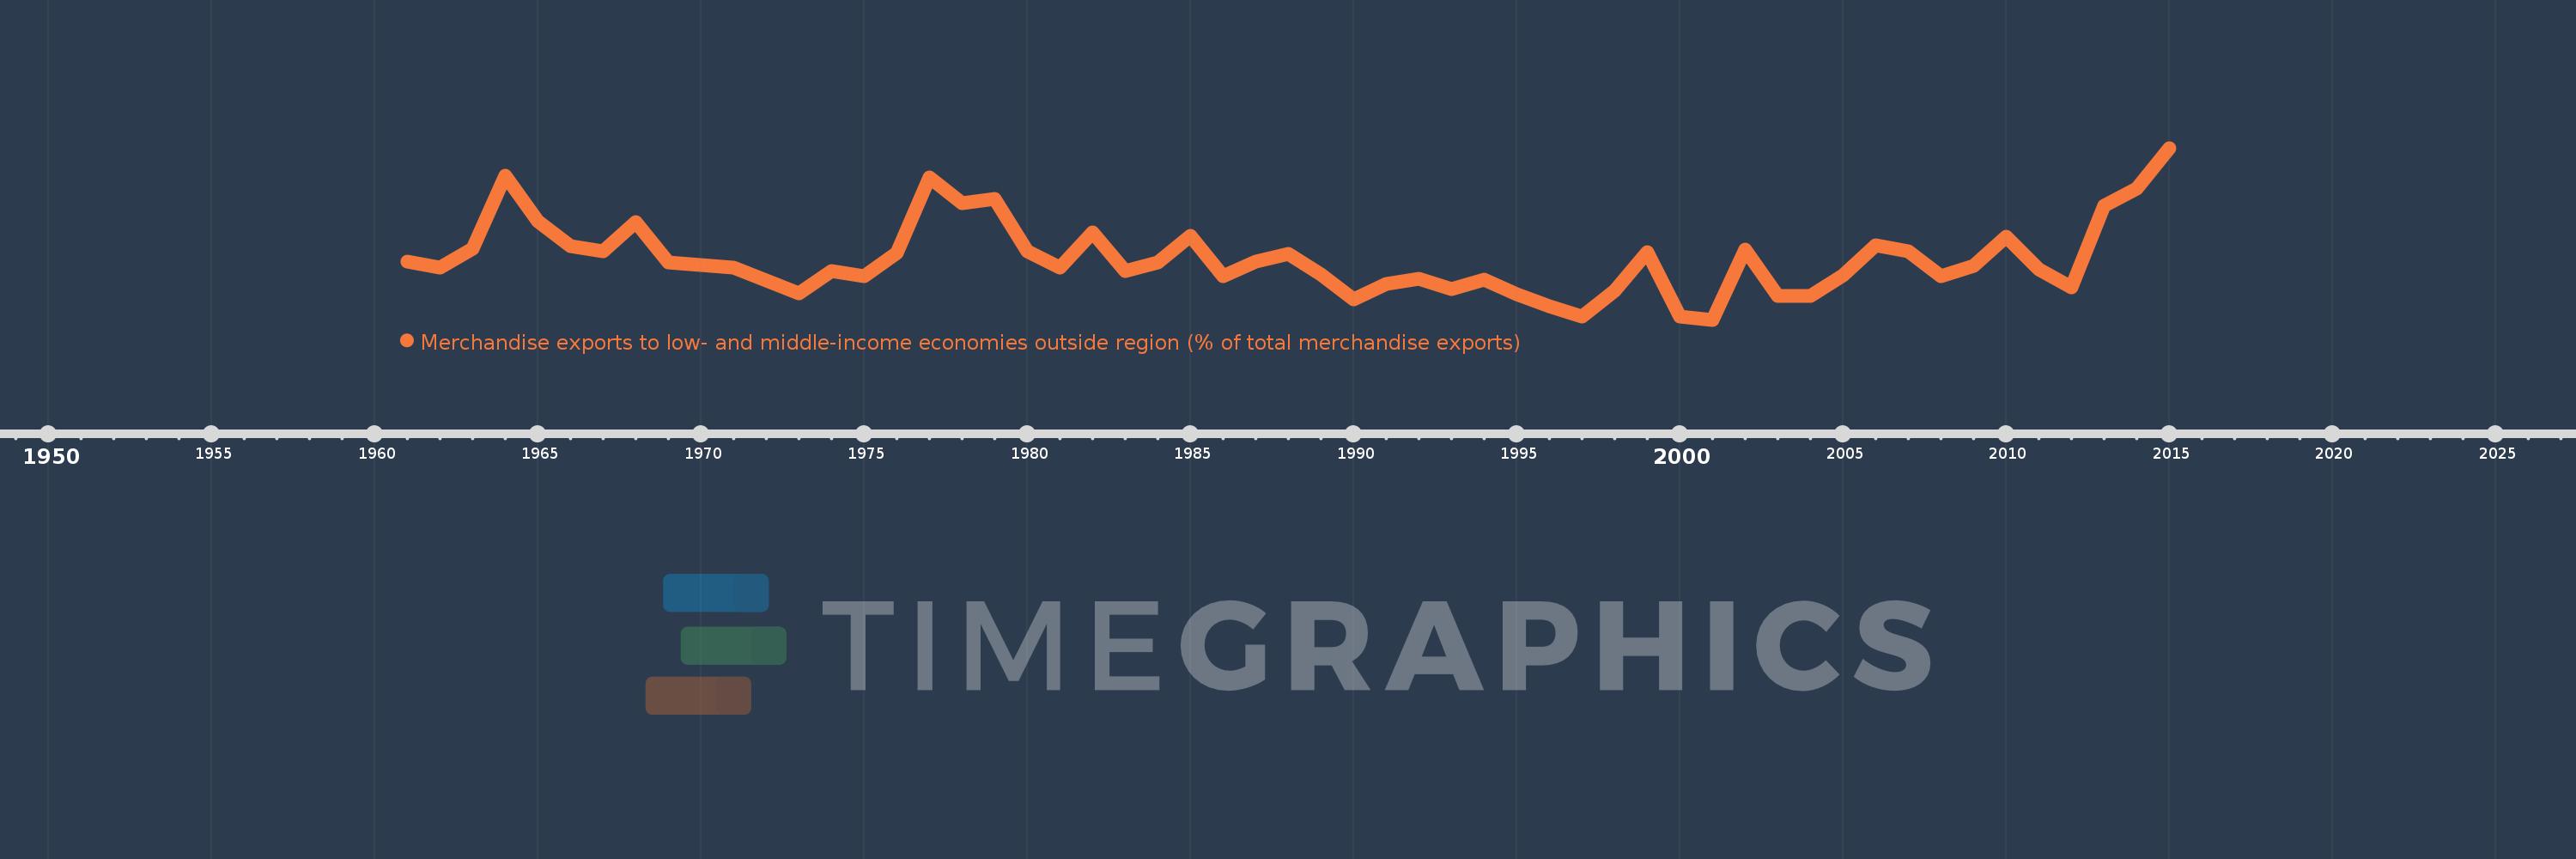
Merchandise exports to low- and middle-income economies outside region (% of total merchandise exports)
2015,2014,2013,2012,2011,2010,2009,2008,2007,2006,2005,2004,2003,2002,2001,2000,1999,1998,1997,1996,1995,1994,1993,1992,1991,1990,1989,1988,1987,1986,1985,1984,1983,1982,1981,1980,1979,1978,1977,1976,1975,1974,1973,1972,1971,1970,1969,1968,1967,1966,1965,1964,1963,1962,1961
This statistics in other country:
AfghanistanAlbaniaAlgeriaAngolaArab WorldArgentinaArmeniaArubaAustraliaAustriaAzerbaijanBahamas, TheBahrainBangladeshBarbadosBelarusBelgiumBelizeBeninBermudaBoliviaBrazilBrunei DarussalamBulgariaBurundiCabo VerdeCambodiaCameroonCanadaCaribbean small statesCentral African RepublicCentral Europe and the BalticsChileChinaColombiaCongo, Dem. Rep.Congo, Rep.Costa RicaCote d'IvoireCroatiaCubaCyprusCzech RepublicDenmarkDominicaDominican RepublicEarly-demographic dividendEast Asia & PacificEast Asia & Pacific (excluding high income)East Asia & Pacific (IDA & IBRD countries)EcuadorEgypt, Arab Rep.El SalvadorEstoniaEthiopiaEuro areaEurope & Central AsiaEurope & Central Asia (excluding high income)Europe & Central Asia (IDA & IBRD countries)European UnionFijiFinlandFragile and conflict affected situationsFranceGabonGambia, TheGeorgiaGermanyGhanaGreeceGreenlandGuatemalaGuineaGuyanaHaitiHeavily indebted poor countries (HIPC)High incomeHondurasHong Kong SAR, ChinaHungaryIBRD onlyIcelandIDA & IBRD totalIDA blendIDA onlyIDA totalIndiaIndonesiaIran, Islamic Rep.IraqIrelandIsraelItalyJamaicaJapanJordanKazakhstanKenyaKorea, Dem. People’s Rep.Korea, Rep.KuwaitLao PDRLate-demographic dividendLatin America & Caribbean Latin America & Caribbean (excluding high income)Latin America & the Caribbean (IDA & IBRD countries)LatviaLeast developed countries: UN classificationLebanonLiberiaLibyaLithuaniaLow & middle incomeLow incomeLower middle incomeLuxembourgMacao SAR, ChinaMacedonia, FYRMadagascarMalawiMalaysiaMaliMaltaMauritaniaMauritiusMexicoMiddle East & North AfricaMiddle East & North Africa (excluding high income)Middle East & North Africa (IDA & IBRD countries)Middle incomeMoldovaMongoliaMontenegroMoroccoMozambiqueMyanmarNetherlandsNew CaledoniaNew ZealandNicaraguaNigerNigeriaNorth AmericaNorwayOECD membersOmanOther small statesPacific island small statesPakistanPanamaPapua New GuineaParaguayPeruPhilippinesPolandPortugalPost-demographic dividendPre-demographic dividendQatarRomaniaRussian FederationRwandaSamoaSaudi ArabiaSenegalSerbiaSeychellesSierra LeoneSingaporeSlovak RepublicSloveniaSmall statesSomaliaSouth AfricaSouth AsiaSouth Asia (IDA & IBRD)SpainSri LankaSt. LuciaSt. Vincent and the GrenadinesSub-Saharan Africa Sub-Saharan Africa (excluding high income)Sub-Saharan Africa (IDA & IBRD countries)SudanSurinameSwedenSwitzerlandSyrian Arab RepublicTanzaniaThailandTogoTrinidad and TobagoTunisiaTurkeyUgandaUkraineUnited Arab EmiratesUnited KingdomUnited StatesUpper middle incomeUruguayVenezuela, RBVietnamWorldYemen, Rep.ZambiaZimbabwe Timeline:
This timeline shows a graph from 1961 to 2015 of Malta. No data until 1960. Number of actual observations by date: 55.
Source name:
World Development Indicators
Source organization:
World Bank staff estimates based data from International Monetary Fund's Direction of Trade database.
Categories, topics:
Private Sector, Trade
Last updated:
apr 23, 2017
Indicators value changes by year
Maximum:
20.589
jan 1, 2015
At the date of observation
Value
Absolute change
Change from previous value
jan 1, 1961
9.524
+9.524
0.0%
jan 1, 1962
8.955
-0.569
-5.97%
jan 1, 1963
10.744
+1.789
19.97%
jan 1, 1964
17.857
+7.113
66.21%
jan 1, 1965
13.472
-4.386
-24.56%
jan 1, 1966
11.017
-2.455
-18.22%
jan 1, 1967
10.526
-0.491
-4.45%
jan 1, 1968
13.333
+2.807
26.67%
jan 1, 1969
9.451
-3.882
-29.12%
jan 1, 1970
9.195
-0.256
-2.71%
jan 1, 1971
8.926
-0.27
-2.93%
jan 1, 1972
7.692
-1.233
-13.82%
jan 1, 1973
6.462
-1.23
-15.99%
jan 1, 1974
8.612
+2.15
33.26%
jan 1, 1975
8.122
-0.489
-5.68%
jan 1, 1976
10.325
+2.202
27.11%
jan 1, 1977
17.758
+7.433
72.0%
jan 1, 1978
15.221
-2.537
-14.29%
jan 1, 1979
15.631
+0.41
2.69%
jan 1, 1980
10.5
-5.131
-32.82%
jan 1, 1981
8.925
-1.575
-15.0%
jan 1, 1982
12.334
+3.409
38.2%
jan 1, 1983
8.578
-3.756
-30.45%
jan 1, 1984
9.429
+0.851
9.92%
jan 1, 1985
11.989
+2.56
27.15%
jan 1, 1986
8.094
-3.895
-32.49%
jan 1, 1987
9.495
+1.402
17.32%
jan 1, 1988
10.252
+0.757
7.97%
jan 1, 1989
8.247
-2.005
-19.56%
jan 1, 1990
5.876
-2.371
-28.75%
jan 1, 1991
7.311
+1.435
24.42%
jan 1, 1992
7.822
+0.511
6.99%
jan 1, 1993
6.843
-0.98
-12.52%
jan 1, 1994
7.787
+0.944
13.8%
jan 1, 1995
6.343
-1.444
-18.54%
jan 1, 1996
5.125
-1.217
-19.19%
jan 1, 1997
4.121
-1.005
-19.6%
jan 1, 1998
6.676
+2.555
62.0%
jan 1, 1999
10.467
+3.792
56.8%
jan 1, 2000
4.174
-6.294
-60.13%
jan 1, 2001
3.852
-0.322
-7.72%
jan 1, 2002
10.696
+6.845
177.71%
jan 1, 2003
6.148
-4.548
-42.52%
jan 1, 2004
6.209
+0.061
0.99%
jan 1, 2005
8.182
+1.973
31.77%
jan 1, 2006
11.07
+2.889
35.31%
jan 1, 2007
10.485
-0.585
-5.28%
jan 1, 2008
8.073
-2.412
-23.0%
jan 1, 2009
9.083
+1.009
12.5%
jan 1, 2010
11.909
+2.826
31.12%
jan 1, 2011
8.777
-3.132
-26.3%
jan 1, 2012
7.032
-1.746
-19.89%
jan 1, 2013
14.971
+7.939
112.91%
jan 1, 2014
16.619
+1.648
11.01%
jan 1, 2015
20.589
+3.97
23.89%
Ranking of countries by current statistics by years


Comments: