29
/
en
AIzaSyAYiBZKx7MnpbEhh9jyipgxe19OcubqV5w
April 1, 2024
156280
Indonesia
IDN
true
2
1
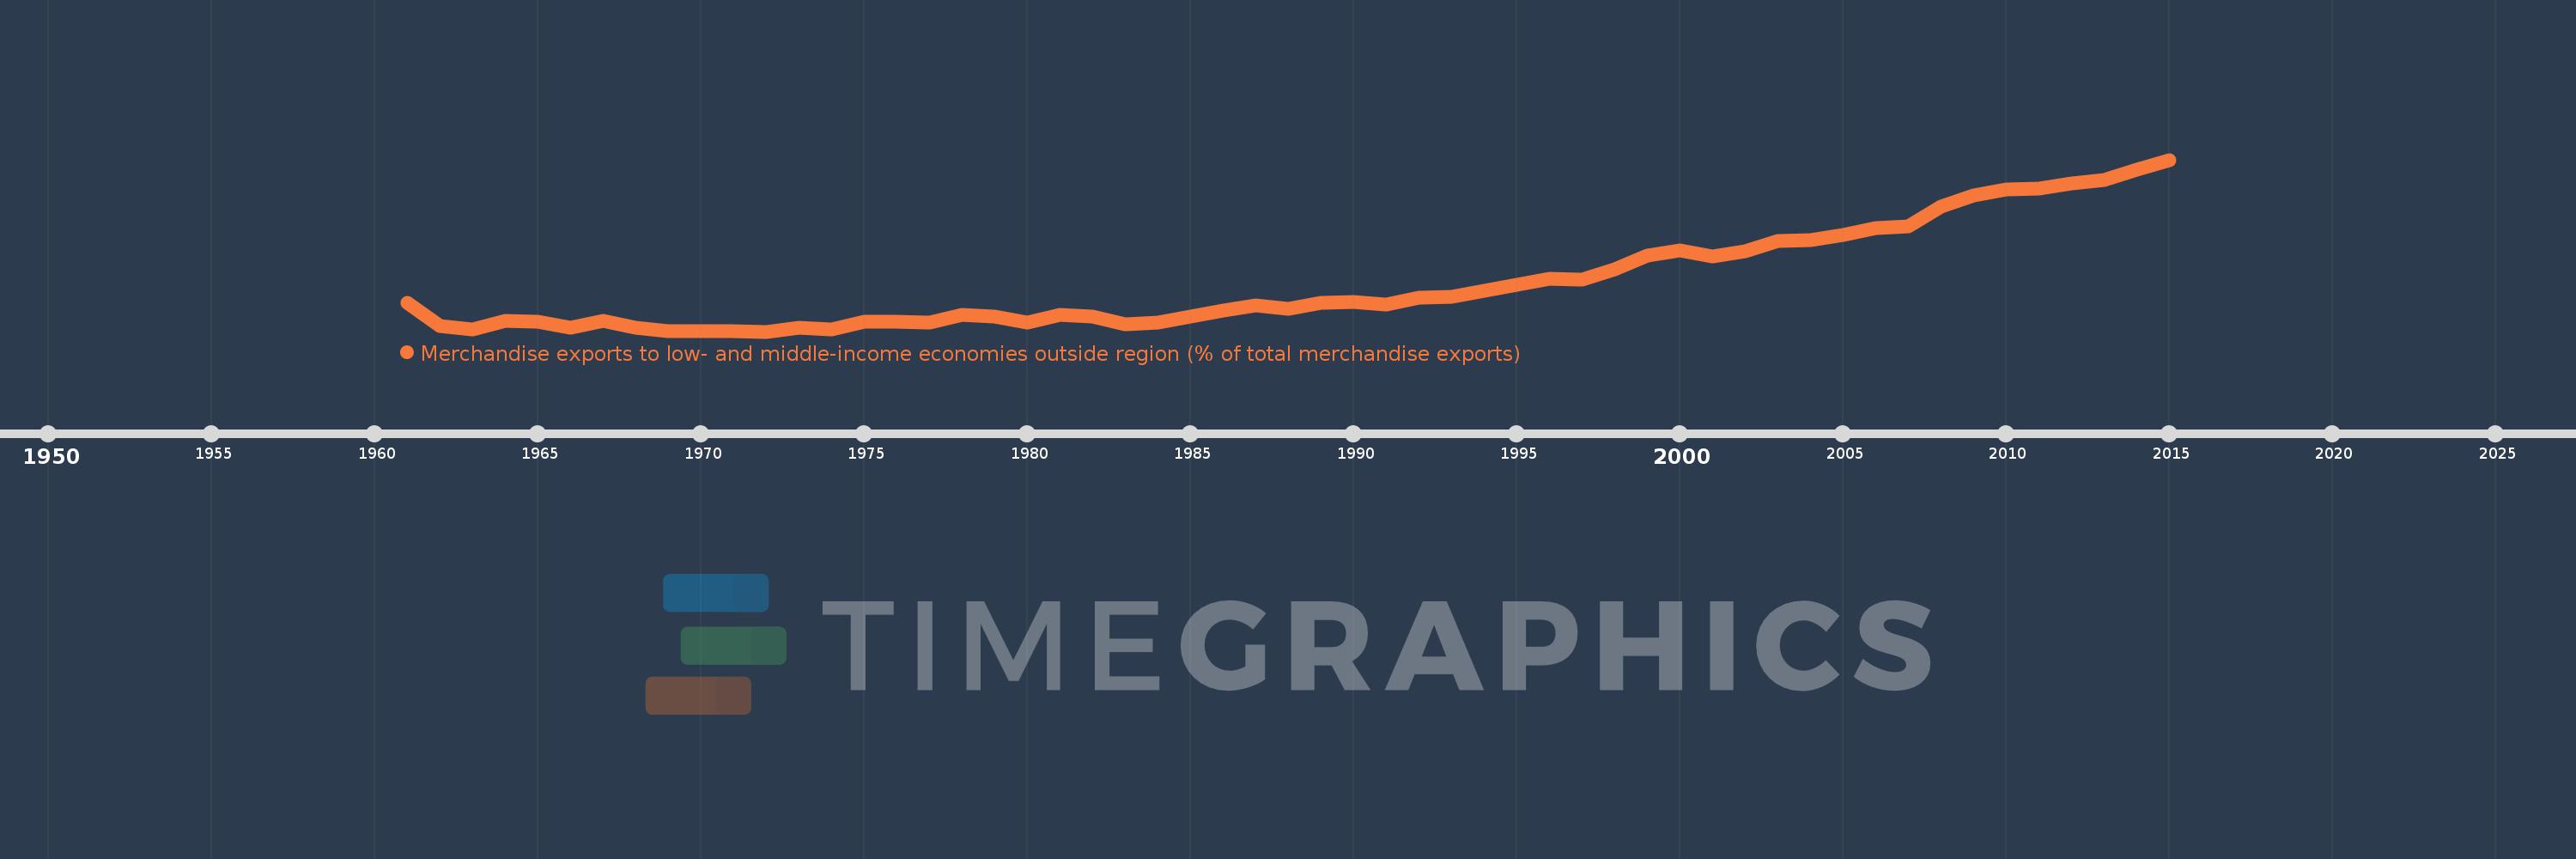
Merchandise exports to low- and middle-income economies outside region (% of total merchandise exports)
2015,2014,2013,2012,2011,2010,2009,2008,2007,2006,2005,2004,2003,2002,2001,2000,1999,1998,1997,1996,1995,1994,1993,1992,1991,1990,1989,1988,1987,1986,1985,1984,1983,1982,1981,1980,1979,1978,1977,1976,1975,1974,1973,1972,1971,1970,1969,1968,1967,1966,1965,1964,1963,1962,1961
This statistics in other country:
AfghanistanAlbaniaAlgeriaAngolaArab WorldArgentinaArmeniaArubaAustraliaAustriaAzerbaijanBahamas, TheBahrainBangladeshBarbadosBelarusBelgiumBelizeBeninBermudaBoliviaBrazilBrunei DarussalamBulgariaBurundiCabo VerdeCambodiaCameroonCanadaCaribbean small statesCentral African RepublicCentral Europe and the BalticsChileChinaColombiaCongo, Dem. Rep.Congo, Rep.Costa RicaCote d'IvoireCroatiaCubaCyprusCzech RepublicDenmarkDominicaDominican RepublicEarly-demographic dividendEast Asia & PacificEast Asia & Pacific (excluding high income)East Asia & Pacific (IDA & IBRD countries)EcuadorEgypt, Arab Rep.El SalvadorEstoniaEthiopiaEuro areaEurope & Central AsiaEurope & Central Asia (excluding high income)Europe & Central Asia (IDA & IBRD countries)European UnionFijiFinlandFragile and conflict affected situationsFranceGabonGambia, TheGeorgiaGermanyGhanaGreeceGreenlandGuatemalaGuineaGuyanaHaitiHeavily indebted poor countries (HIPC)High incomeHondurasHong Kong SAR, ChinaHungaryIBRD onlyIcelandIDA & IBRD totalIDA blendIDA onlyIDA totalIndiaIndonesiaIran, Islamic Rep.IraqIrelandIsraelItalyJamaicaJapanJordanKazakhstanKenyaKorea, Dem. People’s Rep.Korea, Rep.KuwaitLao PDRLate-demographic dividendLatin America & Caribbean Latin America & Caribbean (excluding high income)Latin America & the Caribbean (IDA & IBRD countries)LatviaLeast developed countries: UN classificationLebanonLiberiaLibyaLithuaniaLow & middle incomeLow incomeLower middle incomeLuxembourgMacao SAR, ChinaMacedonia, FYRMadagascarMalawiMalaysiaMaliMaltaMauritaniaMauritiusMexicoMiddle East & North AfricaMiddle East & North Africa (excluding high income)Middle East & North Africa (IDA & IBRD countries)Middle incomeMoldovaMongoliaMontenegroMoroccoMozambiqueMyanmarNetherlandsNew CaledoniaNew ZealandNicaraguaNigerNigeriaNorth AmericaNorwayOECD membersOmanOther small statesPacific island small statesPakistanPanamaPapua New GuineaParaguayPeruPhilippinesPolandPortugalPost-demographic dividendPre-demographic dividendQatarRomaniaRussian FederationRwandaSamoaSaudi ArabiaSenegalSerbiaSeychellesSierra LeoneSingaporeSlovak RepublicSloveniaSmall statesSomaliaSouth AfricaSouth AsiaSouth Asia (IDA & IBRD)SpainSri LankaSt. LuciaSt. Vincent and the GrenadinesSub-Saharan Africa Sub-Saharan Africa (excluding high income)Sub-Saharan Africa (IDA & IBRD countries)SudanSurinameSwedenSwitzerlandSyrian Arab RepublicTanzaniaThailandTogoTrinidad and TobagoTunisiaTurkeyUgandaUkraineUnited Arab EmiratesUnited KingdomUnited StatesUpper middle incomeUruguayVenezuela, RBVietnamWorldYemen, Rep.ZambiaZimbabwe Timeline:
This timeline shows a graph from 1961 to 2015 of Indonesia. No data until 1960. Number of actual observations by date: 55.
Source name:
World Development Indicators
Source organization:
World Bank staff estimates based data from International Monetary Fund's Direction of Trade database.
Categories, topics:
Private Sector, Trade
Last updated:
apr 23, 2017
Indicators value changes by year
Maximum:
16.226
jan 1, 2015
At the date of observation
Value
Absolute change
Change from previous value
jan 1, 1961
2.679
+2.679
0.0%
jan 1, 1962
0.558
-2.12
-79.15%
jan 1, 1963
0.225
-0.334
-59.77%
jan 1, 1964
0.999
+0.774
344.67%
jan 1, 1965
0.902
-0.097
-9.7%
jan 1, 1966
0.332
-0.571
-63.25%
jan 1, 1967
1.012
+0.68
205.21%
jan 1, 1968
0.382
-0.63
-62.23%
jan 1, 1969
0.013
-0.369
-96.5%
jan 1, 1970
0.024
+0.01
76.18%
jan 1, 1971
0.009
-0.015
-61.66%
jan 1, 1972
0.0
-0.009
-100.0%
jan 1, 1974
0.169
-0.181
-51.79%
jan 1, 1975
0.945
+0.777
460.56%
jan 1, 1976
0.966
+0.02
2.16%
jan 1, 1977
0.859
-0.107
-11.08%
jan 1, 1978
1.542
+0.684
79.6%
jan 1, 1979
1.406
-0.136
-8.85%
jan 1, 1980
0.865
-0.541
-38.46%
jan 1, 1981
1.56
+0.695
80.29%
jan 1, 1982
1.413
-0.147
-9.41%
jan 1, 1983
0.654
-0.759
-53.72%
jan 1, 1984
0.872
+0.218
33.31%
jan 1, 1985
1.414
+0.542
62.17%
jan 1, 1986
1.957
+0.543
38.43%
jan 1, 1987
2.514
+0.557
28.44%
jan 1, 1988
2.116
-0.398
-15.85%
jan 1, 1989
2.697
+0.581
27.48%
jan 1, 1990
2.769
+0.072
2.67%
jan 1, 1991
2.596
-0.173
-6.23%
jan 1, 1992
3.221
+0.625
24.06%
jan 1, 1993
3.325
+0.104
3.23%
jan 1, 1994
3.869
+0.544
16.36%
jan 1, 1995
4.394
+0.525
13.56%
jan 1, 1996
5.004
+0.61
13.89%
jan 1, 1997
4.896
-0.108
-2.16%
jan 1, 1998
5.89
+0.994
20.29%
jan 1, 1999
7.189
+1.299
22.06%
jan 1, 2000
7.644
+0.455
6.33%
jan 1, 2001
7.127
-0.517
-6.76%
jan 1, 2002
7.609
+0.482
6.76%
jan 1, 2003
8.545
+0.936
12.3%
jan 1, 2004
8.66
+0.115
1.35%
jan 1, 2005
9.131
+0.471
5.44%
jan 1, 2006
9.788
+0.656
7.19%
jan 1, 2007
9.923
+0.135
1.38%
jan 1, 2008
11.814
+1.891
19.06%
jan 1, 2009
12.884
+1.07
9.06%
jan 1, 2010
13.439
+0.555
4.31%
jan 1, 2011
13.477
+0.038
0.28%
jan 1, 2012
13.956
+0.479
3.55%
jan 1, 2013
14.303
+0.348
2.49%
jan 1, 2014
15.306
+1.003
7.01%
jan 1, 2015
16.226
+0.919
6.01%
Ranking of countries by current statistics by years


Comments: