29
/
en
AIzaSyAYiBZKx7MnpbEhh9jyipgxe19OcubqV5w
April 1, 2024
129607
Estonia
EST
true
2
1
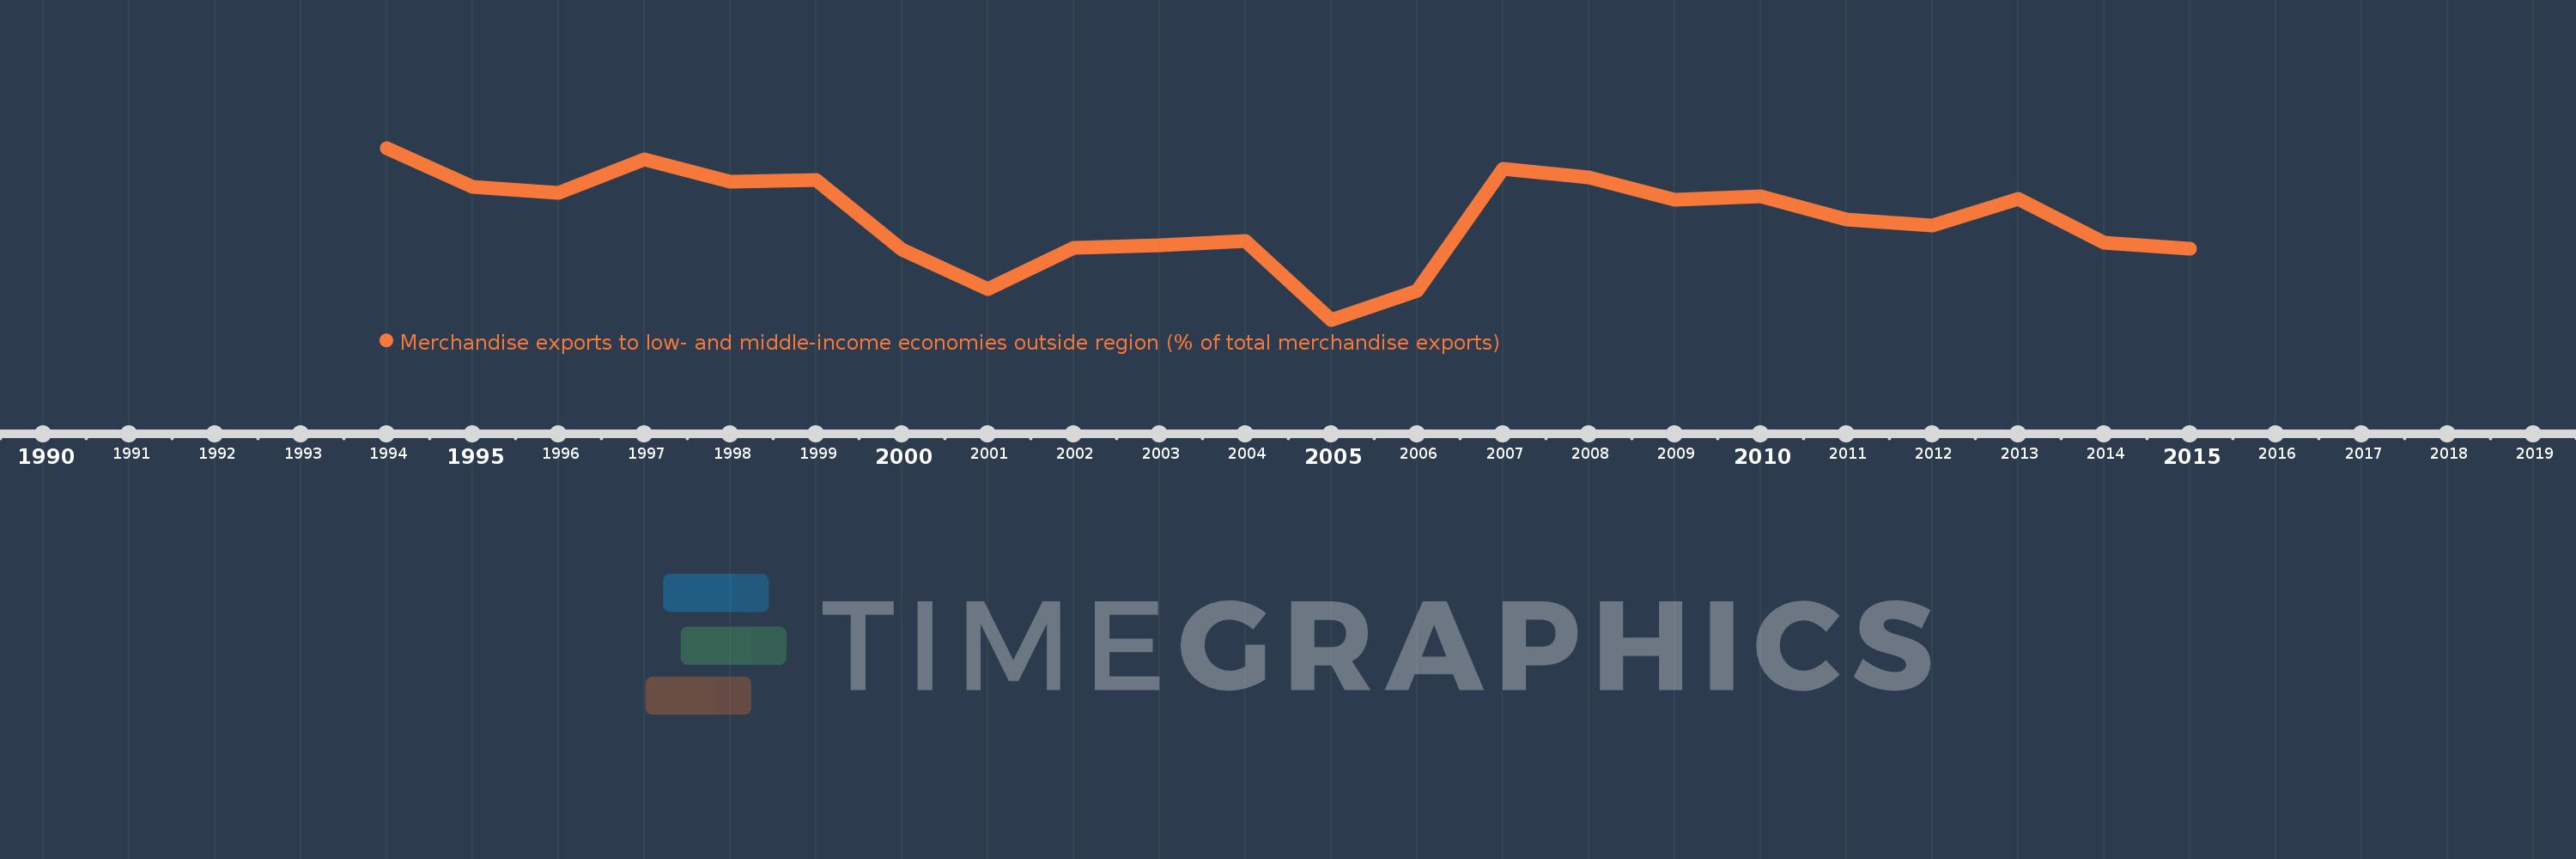
Merchandise exports to low- and middle-income economies outside region (% of total merchandise exports)
2015,2014,2013,2012,2011,2010,2009,2008,2007,2006,2005,2004,2003,2002,2001,2000,1999,1998,1997,1996,1995,1994
This statistics in other country:
AfghanistanAlbaniaAlgeriaAngolaArab WorldArgentinaArmeniaArubaAustraliaAustriaAzerbaijanBahamas, TheBahrainBangladeshBarbadosBelarusBelgiumBelizeBeninBermudaBoliviaBrazilBrunei DarussalamBulgariaBurundiCabo VerdeCambodiaCameroonCanadaCaribbean small statesCentral African RepublicCentral Europe and the BalticsChileChinaColombiaCongo, Dem. Rep.Congo, Rep.Costa RicaCote d'IvoireCroatiaCubaCyprusCzech RepublicDenmarkDominicaDominican RepublicEarly-demographic dividendEast Asia & PacificEast Asia & Pacific (excluding high income)East Asia & Pacific (IDA & IBRD countries)EcuadorEgypt, Arab Rep.El SalvadorEstoniaEthiopiaEuro areaEurope & Central AsiaEurope & Central Asia (excluding high income)Europe & Central Asia (IDA & IBRD countries)European UnionFijiFinlandFragile and conflict affected situationsFranceGabonGambia, TheGeorgiaGermanyGhanaGreeceGreenlandGuatemalaGuineaGuyanaHaitiHeavily indebted poor countries (HIPC)High incomeHondurasHong Kong SAR, ChinaHungaryIBRD onlyIcelandIDA & IBRD totalIDA blendIDA onlyIDA totalIndiaIndonesiaIran, Islamic Rep.IraqIrelandIsraelItalyJamaicaJapanJordanKazakhstanKenyaKorea, Dem. People’s Rep.Korea, Rep.KuwaitLao PDRLate-demographic dividendLatin America & Caribbean Latin America & Caribbean (excluding high income)Latin America & the Caribbean (IDA & IBRD countries)LatviaLeast developed countries: UN classificationLebanonLiberiaLibyaLithuaniaLow & middle incomeLow incomeLower middle incomeLuxembourgMacao SAR, ChinaMacedonia, FYRMadagascarMalawiMalaysiaMaliMaltaMauritaniaMauritiusMexicoMiddle East & North AfricaMiddle East & North Africa (excluding high income)Middle East & North Africa (IDA & IBRD countries)Middle incomeMoldovaMongoliaMontenegroMoroccoMozambiqueMyanmarNetherlandsNew CaledoniaNew ZealandNicaraguaNigerNigeriaNorth AmericaNorwayOECD membersOmanOther small statesPacific island small statesPakistanPanamaPapua New GuineaParaguayPeruPhilippinesPolandPortugalPost-demographic dividendPre-demographic dividendQatarRomaniaRussian FederationRwandaSamoaSaudi ArabiaSenegalSerbiaSeychellesSierra LeoneSingaporeSlovak RepublicSloveniaSmall statesSomaliaSouth AfricaSouth AsiaSouth Asia (IDA & IBRD)SpainSri LankaSt. LuciaSt. Vincent and the GrenadinesSub-Saharan Africa Sub-Saharan Africa (excluding high income)Sub-Saharan Africa (IDA & IBRD countries)SudanSurinameSwedenSwitzerlandSyrian Arab RepublicTanzaniaThailandTogoTrinidad and TobagoTunisiaTurkeyUgandaUkraineUnited Arab EmiratesUnited KingdomUnited StatesUpper middle incomeUruguayVenezuela, RBVietnamWorldYemen, Rep.ZambiaZimbabwe Timeline:
This timeline shows a graph from 1994 to 2015 of Estonia. No data until 1993. Number of actual observations by date: 22.
Source name:
World Development Indicators
Source organization:
World Bank staff estimates based data from International Monetary Fund's Direction of Trade database.
Categories, topics:
Private Sector, Trade
Last updated:
apr 23, 2017
Indicators value changes by year
Maximum:
10.594
jan 1, 1994
At the date of observation
Value
Absolute change
Change from previous value
jan 1, 1994
10.594
+10.594
0.0%
jan 1, 1995
9.037
-1.557
-14.7%
jan 1, 1996
8.788
-0.25
-2.76%
jan 1, 1997
10.131
+1.343
15.28%
jan 1, 1998
9.234
-0.896
-8.84%
jan 1, 1999
9.305
+0.07
0.76%
jan 1, 2000
6.545
-2.76
-29.66%
jan 1, 2001
4.974
-1.571
-24.01%
jan 1, 2002
6.6
+1.627
32.71%
jan 1, 2003
6.722
+0.122
1.85%
jan 1, 2004
6.882
+0.16
2.38%
jan 1, 2005
3.734
-3.148
-45.74%
jan 1, 2006
4.877
+1.143
30.59%
jan 1, 2007
9.752
+4.875
99.96%
jan 1, 2008
9.413
-0.339
-3.47%
jan 1, 2009
8.514
-0.899
-9.55%
jan 1, 2010
8.665
+0.151
1.77%
jan 1, 2011
7.748
-0.917
-10.58%
jan 1, 2012
7.505
-0.243
-3.14%
jan 1, 2013
8.56
+1.055
14.06%
jan 1, 2014
6.819
-1.741
-20.34%
jan 1, 2015
6.576
-0.243
-3.57%
Ranking of countries by current statistics by years


Comments: