29
/
en
AIzaSyAYiBZKx7MnpbEhh9jyipgxe19OcubqV5w
April 1, 2024
61823
Upper middle income
UMC
false
2
1
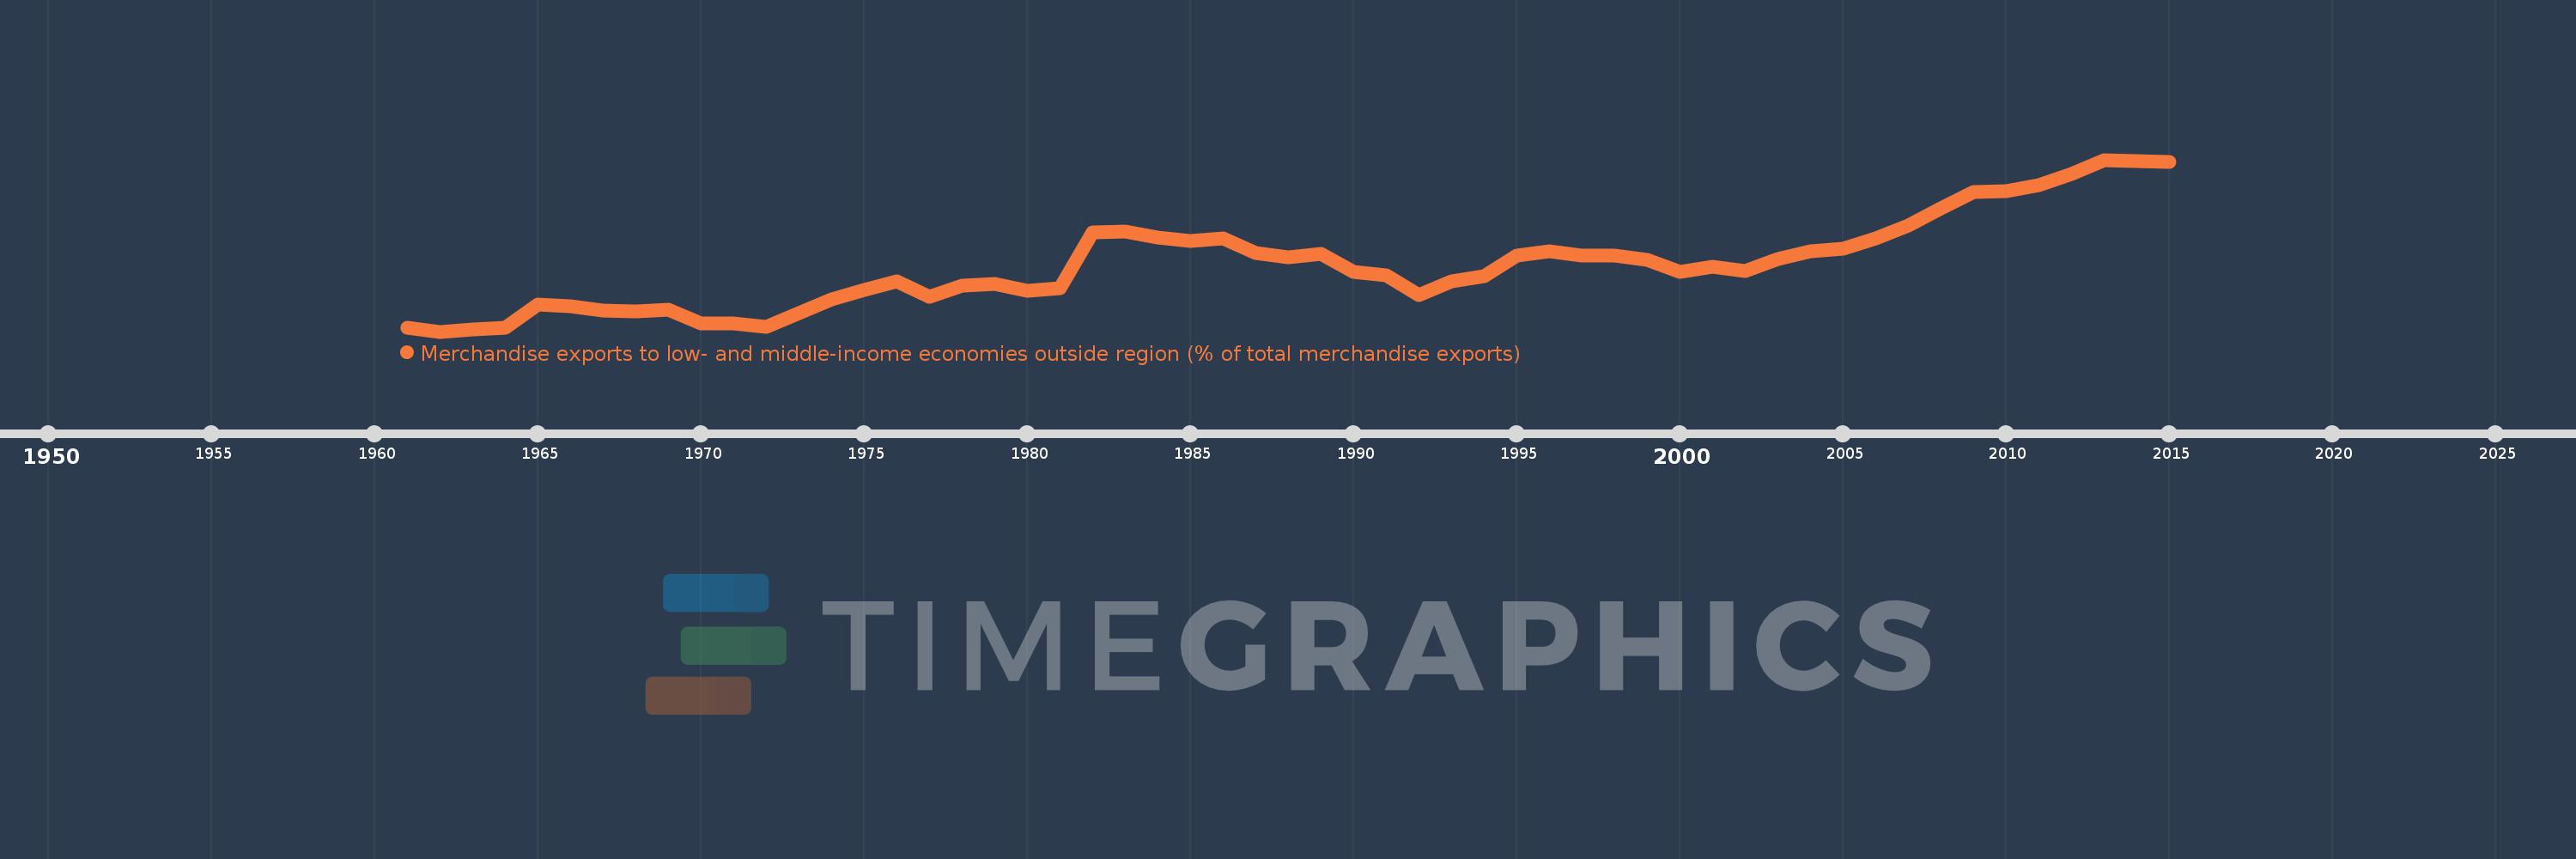
Merchandise exports to low- and middle-income economies outside region (% of total merchandise exports)
2015,2014,2013,2012,2011,2010,2009,2008,2007,2006,2005,2004,2003,2002,2001,2000,1999,1998,1997,1996,1995,1994,1993,1992,1991,1990,1989,1988,1987,1986,1985,1984,1983,1982,1981,1980,1979,1978,1977,1976,1975,1974,1973,1972,1971,1970,1969,1968,1967,1966,1965,1964,1963,1962,1961
This statistics in other country:
AfghanistanAlbaniaAlgeriaAngolaArab WorldArgentinaArmeniaArubaAustraliaAustriaAzerbaijanBahamas, TheBahrainBangladeshBarbadosBelarusBelgiumBelizeBeninBermudaBoliviaBrazilBrunei DarussalamBulgariaBurundiCabo VerdeCambodiaCameroonCanadaCaribbean small statesCentral African RepublicCentral Europe and the BalticsChileChinaColombiaCongo, Dem. Rep.Congo, Rep.Costa RicaCote d'IvoireCroatiaCubaCyprusCzech RepublicDenmarkDominicaDominican RepublicEarly-demographic dividendEast Asia & PacificEast Asia & Pacific (excluding high income)East Asia & Pacific (IDA & IBRD countries)EcuadorEgypt, Arab Rep.El SalvadorEstoniaEthiopiaEuro areaEurope & Central AsiaEurope & Central Asia (excluding high income)Europe & Central Asia (IDA & IBRD countries)European UnionFijiFinlandFragile and conflict affected situationsFranceGabonGambia, TheGeorgiaGermanyGhanaGreeceGreenlandGuatemalaGuineaGuyanaHaitiHeavily indebted poor countries (HIPC)High incomeHondurasHong Kong SAR, ChinaHungaryIBRD onlyIcelandIDA & IBRD totalIDA blendIDA onlyIDA totalIndiaIndonesiaIran, Islamic Rep.IraqIrelandIsraelItalyJamaicaJapanJordanKazakhstanKenyaKorea, Dem. People’s Rep.Korea, Rep.KuwaitLao PDRLate-demographic dividendLatin America & Caribbean Latin America & Caribbean (excluding high income)Latin America & the Caribbean (IDA & IBRD countries)LatviaLeast developed countries: UN classificationLebanonLiberiaLibyaLithuaniaLow & middle incomeLow incomeLower middle incomeLuxembourgMacao SAR, ChinaMacedonia, FYRMadagascarMalawiMalaysiaMaliMaltaMauritaniaMauritiusMexicoMiddle East & North AfricaMiddle East & North Africa (excluding high income)Middle East & North Africa (IDA & IBRD countries)Middle incomeMoldovaMongoliaMontenegroMoroccoMozambiqueMyanmarNetherlandsNew CaledoniaNew ZealandNicaraguaNigerNigeriaNorth AmericaNorwayOECD membersOmanOther small statesPacific island small statesPakistanPanamaPapua New GuineaParaguayPeruPhilippinesPolandPortugalPost-demographic dividendPre-demographic dividendQatarRomaniaRussian FederationRwandaSamoaSaudi ArabiaSenegalSerbiaSeychellesSierra LeoneSingaporeSlovak RepublicSloveniaSmall statesSomaliaSouth AfricaSouth AsiaSouth Asia (IDA & IBRD)SpainSri LankaSt. LuciaSt. Vincent and the GrenadinesSub-Saharan Africa Sub-Saharan Africa (excluding high income)Sub-Saharan Africa (IDA & IBRD countries)SudanSurinameSwedenSwitzerlandSyrian Arab RepublicTanzaniaThailandTogoTrinidad and TobagoTunisiaTurkeyUgandaUkraineUnited Arab EmiratesUnited KingdomUnited StatesUpper middle incomeUruguayVenezuela, RBVietnamWorldYemen, Rep.ZambiaZimbabwe Timeline:
This timeline shows a graph from 1961 to 2015 of Upper middle income. No data until 1960. Number of actual observations by date: 55.
Source name:
World Development Indicators
Source organization:
World Bank staff estimates based data from International Monetary Fund's Direction of Trade database.
Categories, topics:
Private Sector, Trade
Last updated:
apr 23, 2017
Indicators value changes by year
Maximum:
20.216
jan 1, 2013
At the date of observation
Value
Absolute change
Change from previous value
jan 1, 1961
4.101
+4.101
0.0%
jan 1, 1962
3.717
-0.384
-9.35%
jan 1, 1963
3.942
+0.225
6.05%
jan 1, 1964
4.074
+0.132
3.36%
jan 1, 1965
6.311
+2.236
54.89%
jan 1, 1966
6.165
-0.146
-2.31%
jan 1, 1967
5.754
-0.41
-6.66%
jan 1, 1968
5.652
-0.103
-1.79%
jan 1, 1969
5.831
+0.18
3.18%
jan 1, 1970
4.533
-1.298
-22.26%
jan 1, 1971
4.528
-0.005
-0.11%
jan 1, 1972
4.164
-0.364
-8.05%
jan 1, 1973
5.509
+1.345
32.32%
jan 1, 1974
6.8
+1.291
23.43%
jan 1, 1975
7.747
+0.947
13.93%
jan 1, 1976
8.56
+0.813
10.49%
jan 1, 1977
7.092
-1.467
-17.14%
jan 1, 1978
8.159
+1.067
15.04%
jan 1, 1979
8.288
+0.129
1.58%
jan 1, 1980
7.65
-0.638
-7.7%
jan 1, 1981
7.905
+0.255
3.34%
jan 1, 1982
13.261
+5.356
67.75%
jan 1, 1983
13.367
+0.106
0.8%
jan 1, 1984
12.788
-0.578
-4.33%
jan 1, 1985
12.454
-0.335
-2.62%
jan 1, 1986
12.659
+0.205
1.65%
jan 1, 1987
11.281
-1.377
-10.88%
jan 1, 1988
10.89
-0.391
-3.47%
jan 1, 1989
11.158
+0.268
2.46%
jan 1, 1990
9.447
-1.712
-15.34%
jan 1, 1991
9.127
-0.32
-3.39%
jan 1, 1992
7.205
-1.922
-21.06%
jan 1, 1993
8.559
+1.354
18.79%
jan 1, 1994
9.071
+0.513
5.99%
jan 1, 1995
11.001
+1.93
21.27%
jan 1, 1996
11.44
+0.438
3.99%
jan 1, 1997
11.014
-0.425
-3.72%
jan 1, 1998
11.033
+0.019
0.17%
jan 1, 1999
10.598
-0.435
-3.94%
jan 1, 2000
9.447
-1.151
-10.86%
jan 1, 2001
9.959
+0.512
5.42%
jan 1, 2002
9.573
-0.387
-3.88%
jan 1, 2003
10.702
+1.129
11.79%
jan 1, 2004
11.446
+0.744
6.96%
jan 1, 2005
11.7
+0.254
2.22%
jan 1, 2006
12.631
+0.931
7.96%
jan 1, 2007
13.886
+1.255
9.93%
jan 1, 2008
15.562
+1.676
12.07%
jan 1, 2009
17.083
+1.521
9.77%
jan 1, 2010
17.18
+0.098
0.57%
jan 1, 2011
17.758
+0.578
3.36%
jan 1, 2012
18.85
+1.092
6.15%
jan 1, 2013
20.216
+1.366
7.25%
jan 1, 2014
20.054
-0.161
-0.8%
jan 1, 2015
20.014
-0.04
-0.2%
Ranking of countries by current statistics by years


Comments: