29
/
en
AIzaSyAYiBZKx7MnpbEhh9jyipgxe19OcubqV5w
April 1, 2024
262540
Thailand
THA
true
2
1
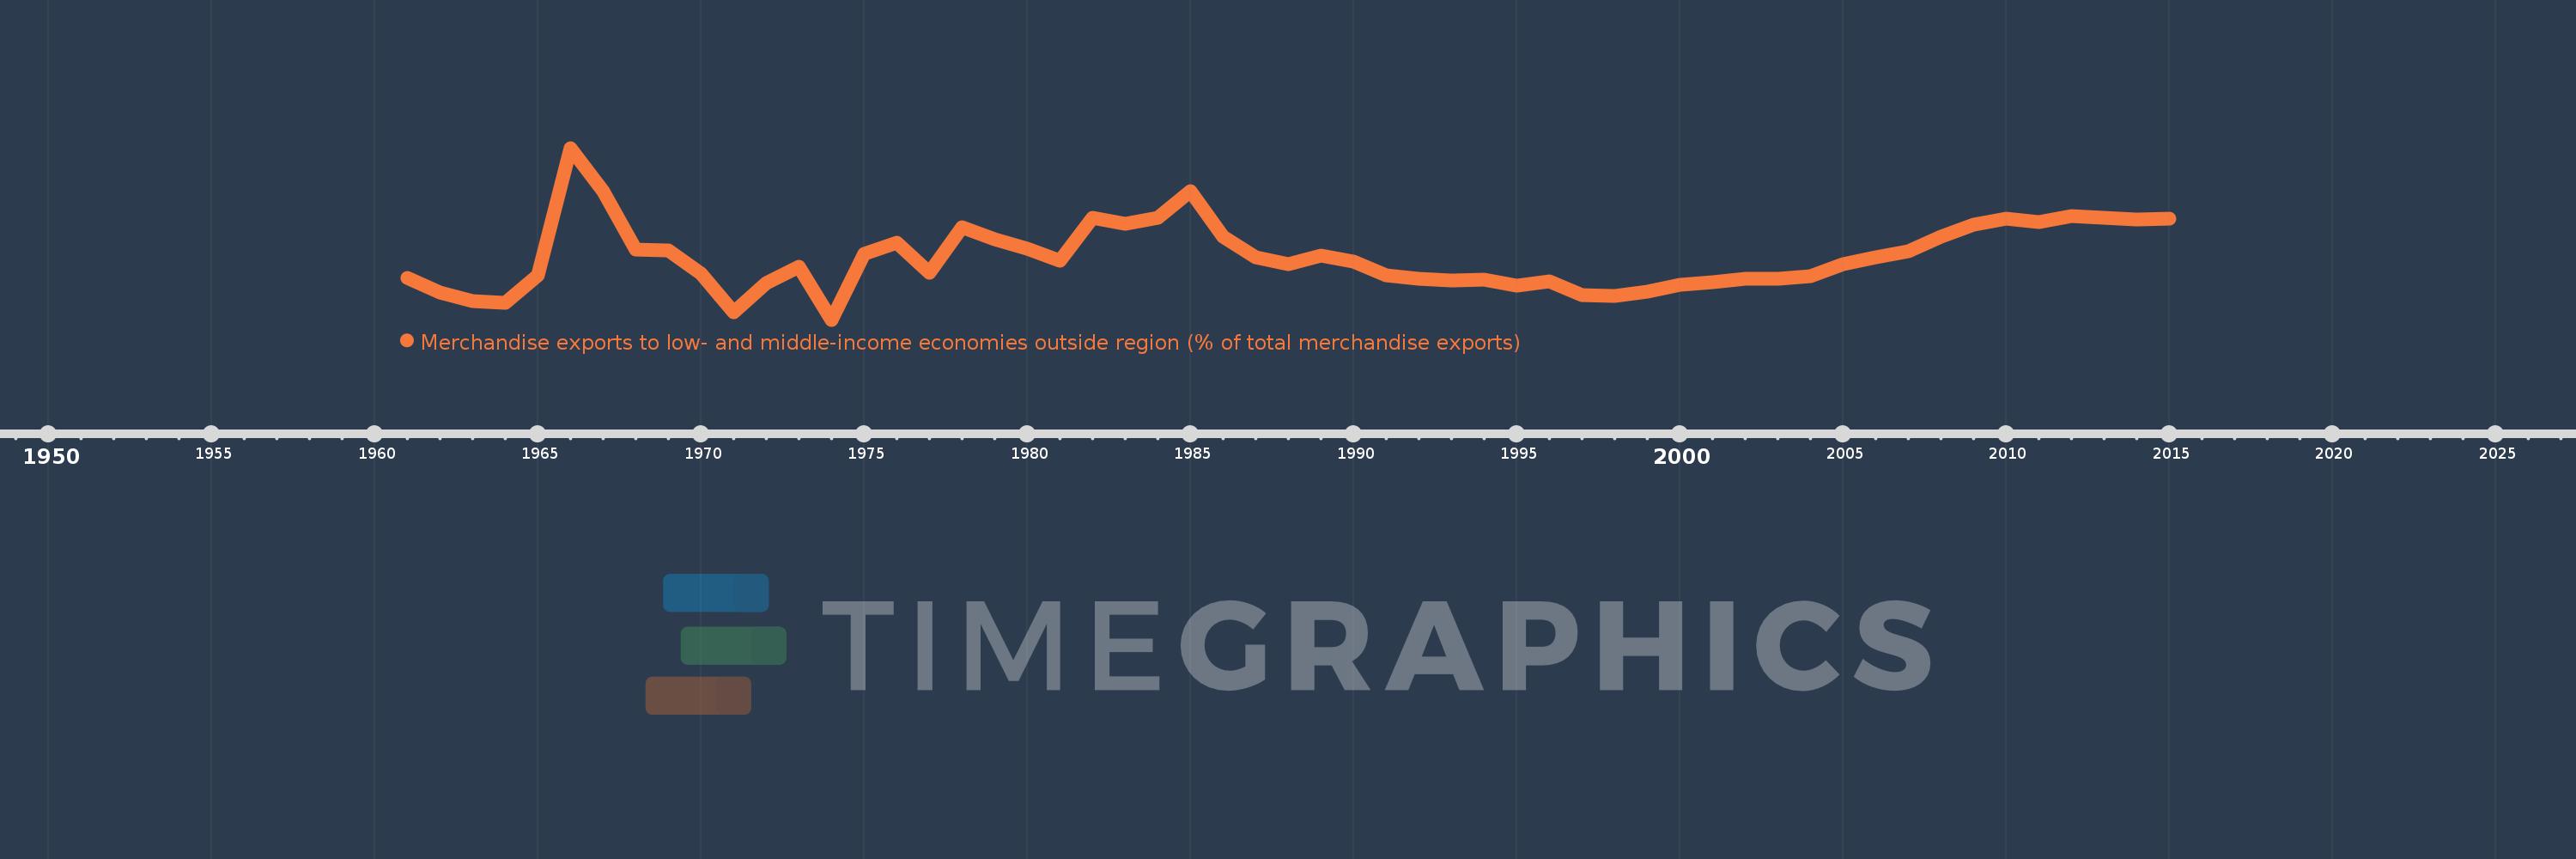
Merchandise exports to low- and middle-income economies outside region (% of total merchandise exports)
2015,2014,2013,2012,2011,2010,2009,2008,2007,2006,2005,2004,2003,2002,2001,2000,1999,1998,1997,1996,1995,1994,1993,1992,1991,1990,1989,1988,1987,1986,1985,1984,1983,1982,1981,1980,1979,1978,1977,1976,1975,1974,1973,1972,1971,1970,1969,1968,1967,1966,1965,1964,1963,1962,1961
This statistics in other country:
AfghanistanAlbaniaAlgeriaAngolaArab WorldArgentinaArmeniaArubaAustraliaAustriaAzerbaijanBahamas, TheBahrainBangladeshBarbadosBelarusBelgiumBelizeBeninBermudaBoliviaBrazilBrunei DarussalamBulgariaBurundiCabo VerdeCambodiaCameroonCanadaCaribbean small statesCentral African RepublicCentral Europe and the BalticsChileChinaColombiaCongo, Dem. Rep.Congo, Rep.Costa RicaCote d'IvoireCroatiaCubaCyprusCzech RepublicDenmarkDominicaDominican RepublicEarly-demographic dividendEast Asia & PacificEast Asia & Pacific (excluding high income)East Asia & Pacific (IDA & IBRD countries)EcuadorEgypt, Arab Rep.El SalvadorEstoniaEthiopiaEuro areaEurope & Central AsiaEurope & Central Asia (excluding high income)Europe & Central Asia (IDA & IBRD countries)European UnionFijiFinlandFragile and conflict affected situationsFranceGabonGambia, TheGeorgiaGermanyGhanaGreeceGreenlandGuatemalaGuineaGuyanaHaitiHeavily indebted poor countries (HIPC)High incomeHondurasHong Kong SAR, ChinaHungaryIBRD onlyIcelandIDA & IBRD totalIDA blendIDA onlyIDA totalIndiaIndonesiaIran, Islamic Rep.IraqIrelandIsraelItalyJamaicaJapanJordanKazakhstanKenyaKorea, Dem. People’s Rep.Korea, Rep.KuwaitLao PDRLate-demographic dividendLatin America & Caribbean Latin America & Caribbean (excluding high income)Latin America & the Caribbean (IDA & IBRD countries)LatviaLeast developed countries: UN classificationLebanonLiberiaLibyaLithuaniaLow & middle incomeLow incomeLower middle incomeLuxembourgMacao SAR, ChinaMacedonia, FYRMadagascarMalawiMalaysiaMaliMaltaMauritaniaMauritiusMexicoMiddle East & North AfricaMiddle East & North Africa (excluding high income)Middle East & North Africa (IDA & IBRD countries)Middle incomeMoldovaMongoliaMontenegroMoroccoMozambiqueMyanmarNetherlandsNew CaledoniaNew ZealandNicaraguaNigerNigeriaNorth AmericaNorwayOECD membersOmanOther small statesPacific island small statesPakistanPanamaPapua New GuineaParaguayPeruPhilippinesPolandPortugalPost-demographic dividendPre-demographic dividendQatarRomaniaRussian FederationRwandaSamoaSaudi ArabiaSenegalSerbiaSeychellesSierra LeoneSingaporeSlovak RepublicSloveniaSmall statesSomaliaSouth AfricaSouth AsiaSouth Asia (IDA & IBRD)SpainSri LankaSt. LuciaSt. Vincent and the GrenadinesSub-Saharan Africa Sub-Saharan Africa (excluding high income)Sub-Saharan Africa (IDA & IBRD countries)SudanSurinameSwedenSwitzerlandSyrian Arab RepublicTanzaniaThailandTogoTrinidad and TobagoTunisiaTurkeyUgandaUkraineUnited Arab EmiratesUnited KingdomUnited StatesUpper middle incomeUruguayVenezuela, RBVietnamWorldYemen, Rep.ZambiaZimbabwe Timeline:
This timeline shows a graph from 1961 to 2015 of Thailand. No data until 1960. Number of actual observations by date: 55.
Source name:
World Development Indicators
Source organization:
World Bank staff estimates based data from International Monetary Fund's Direction of Trade database.
Categories, topics:
Private Sector, Trade
Last updated:
apr 23, 2017
Indicators value changes by year
Maximum:
17.111
jan 1, 1966
At the date of observation
Value
Absolute change
Change from previous value
jan 1, 1961
6.159
+6.159
0.0%
jan 1, 1962
4.91
-1.249
-20.28%
jan 1, 1963
4.22
-0.69
-14.05%
jan 1, 1964
4.074
-0.146
-3.45%
jan 1, 1965
6.396
+2.322
56.98%
jan 1, 1966
17.111
+10.715
167.53%
jan 1, 1967
13.446
-3.665
-21.42%
jan 1, 1968
8.58
-4.867
-36.19%
jan 1, 1969
8.48
-0.1
-1.17%
jan 1, 1970
6.565
-1.915
-22.58%
jan 1, 1971
3.248
-3.317
-50.52%
jan 1, 1972
5.727
+2.479
76.31%
jan 1, 1973
7.128
+1.401
24.47%
jan 1, 1974
2.652
-4.476
-62.79%
jan 1, 1975
8.218
+5.565
209.81%
jan 1, 1976
9.139
+0.921
11.21%
jan 1, 1977
6.579
-2.56
-28.01%
jan 1, 1978
10.449
+3.87
58.82%
jan 1, 1979
9.399
-1.051
-10.05%
jan 1, 1980
8.657
-0.741
-7.89%
jan 1, 1981
7.65
-1.008
-11.64%
jan 1, 1982
11.221
+3.571
46.68%
jan 1, 1983
10.762
-0.459
-4.09%
jan 1, 1984
11.223
+0.461
4.29%
jan 1, 1985
13.458
+2.235
19.92%
jan 1, 1986
9.608
-3.85
-28.61%
jan 1, 1987
7.901
-1.708
-17.77%
jan 1, 1988
7.332
-0.569
-7.2%
jan 1, 1989
8.042
+0.71
9.68%
jan 1, 1990
7.518
-0.524
-6.51%
jan 1, 1991
6.388
-1.13
-15.04%
jan 1, 1992
6.088
-0.3
-4.69%
jan 1, 1993
5.991
-0.098
-1.6%
jan 1, 1994
6.0
+0.009
0.15%
jan 1, 1995
5.558
-0.442
-7.36%
jan 1, 1996
5.868
+0.31
5.58%
jan 1, 1997
4.751
-1.117
-19.03%
jan 1, 1998
4.631
-0.12
-2.52%
jan 1, 1999
5.033
+0.402
8.68%
jan 1, 2000
5.574
+0.541
10.74%
jan 1, 2001
5.779
+0.205
3.68%
jan 1, 2002
6.091
+0.312
5.4%
jan 1, 2003
6.094
+0.003
0.05%
jan 1, 2004
6.303
+0.209
3.43%
jan 1, 2005
7.35
+1.047
16.61%
jan 1, 2006
7.881
+0.531
7.22%
jan 1, 2007
8.379
+0.498
6.32%
jan 1, 2008
9.658
+1.279
15.27%
jan 1, 2009
10.667
+1.009
10.45%
jan 1, 2010
11.126
+0.459
4.3%
jan 1, 2011
10.856
-0.27
-2.43%
jan 1, 2012
11.357
+0.501
4.61%
jan 1, 2013
11.266
-0.091
-0.8%
jan 1, 2014
11.078
-0.188
-1.67%
jan 1, 2015
11.19
+0.112
1.01%
Ranking of countries by current statistics by years


Comments: