29
/
en
AIzaSyAYiBZKx7MnpbEhh9jyipgxe19OcubqV5w
April 1, 2024
57285
South Asia
SAS
false
2
1
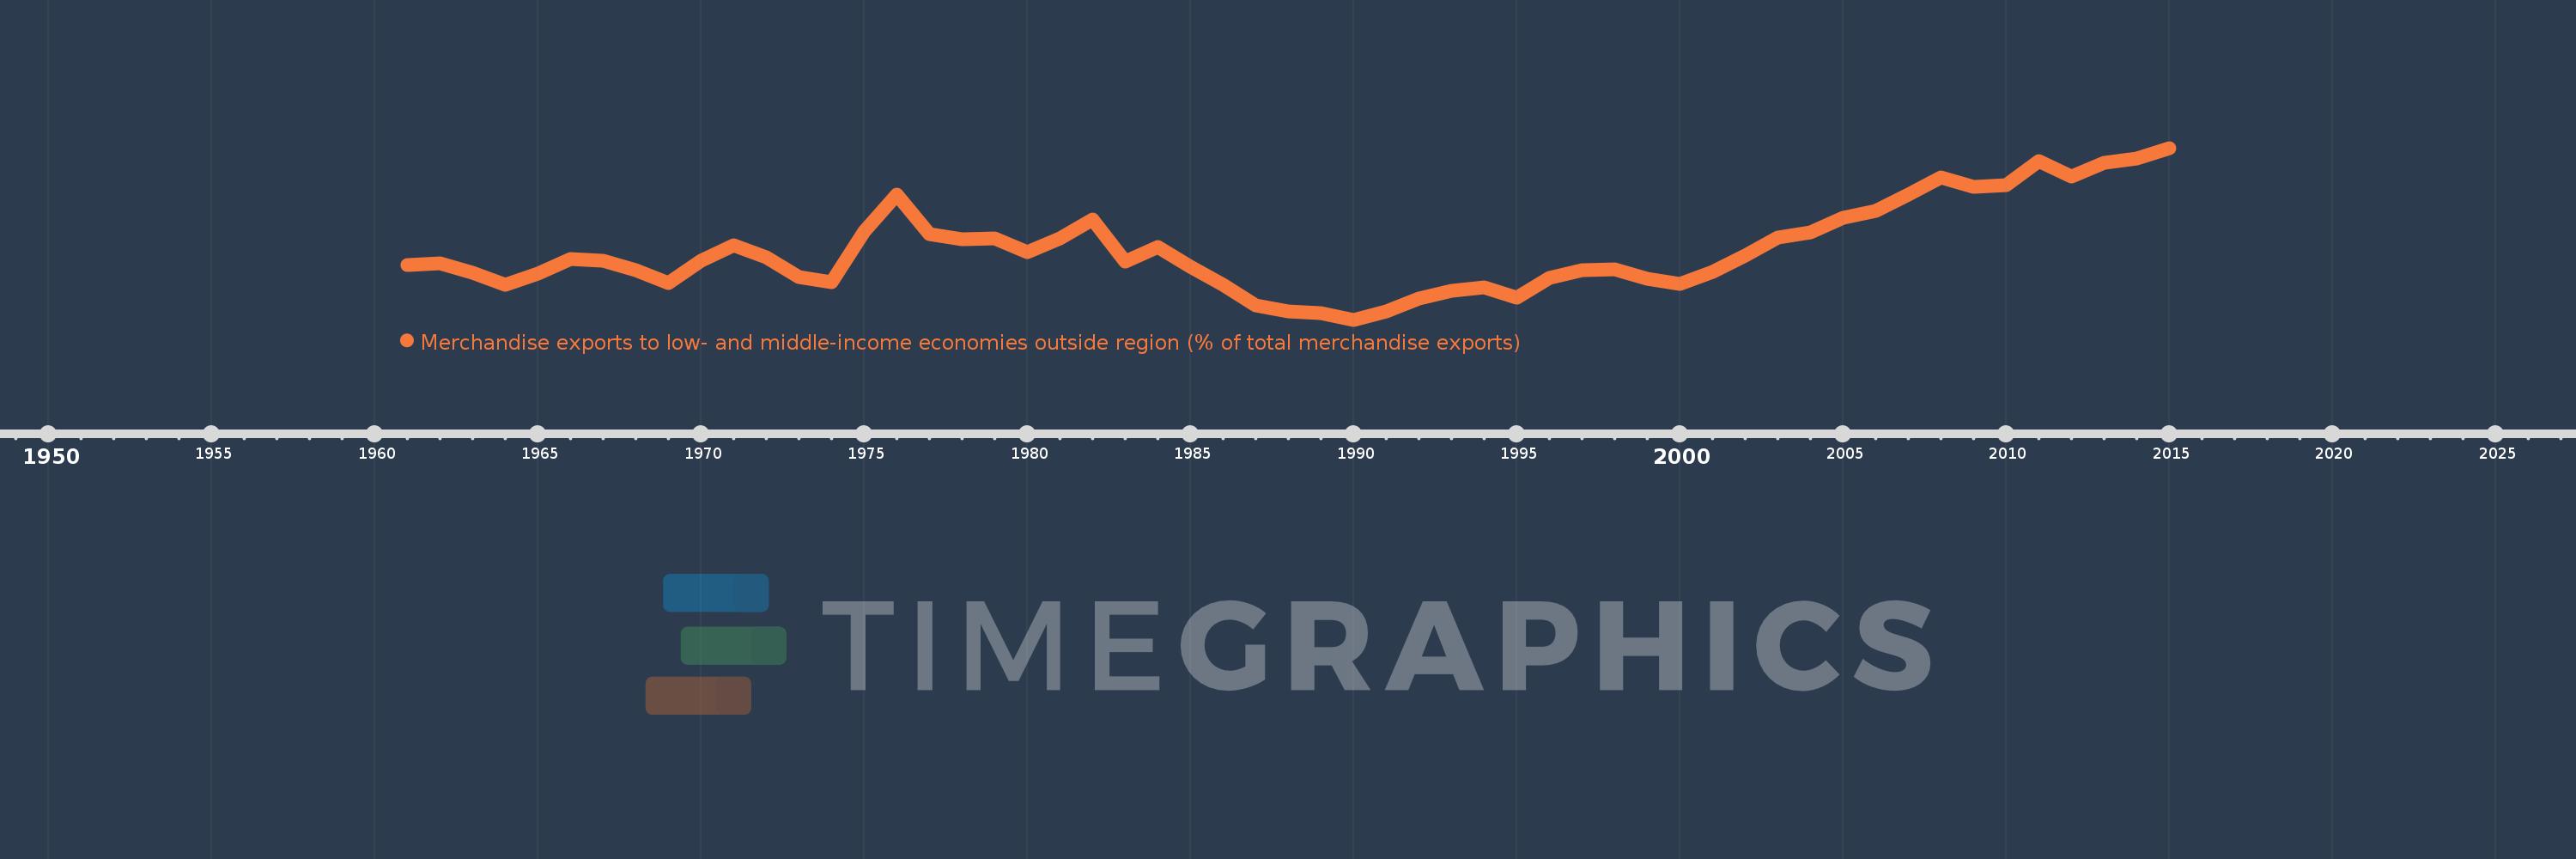
Merchandise exports to low- and middle-income economies outside region (% of total merchandise exports)
2015,2014,2013,2012,2011,2010,2009,2008,2007,2006,2005,2004,2003,2002,2001,2000,1999,1998,1997,1996,1995,1994,1993,1992,1991,1990,1989,1988,1987,1986,1985,1984,1983,1982,1981,1980,1979,1978,1977,1976,1975,1974,1973,1972,1971,1970,1969,1968,1967,1966,1965,1964,1963,1962,1961
This statistics in other country:
AfghanistanAlbaniaAlgeriaAngolaArab WorldArgentinaArmeniaArubaAustraliaAustriaAzerbaijanBahamas, TheBahrainBangladeshBarbadosBelarusBelgiumBelizeBeninBermudaBoliviaBrazilBrunei DarussalamBulgariaBurundiCabo VerdeCambodiaCameroonCanadaCaribbean small statesCentral African RepublicCentral Europe and the BalticsChileChinaColombiaCongo, Dem. Rep.Congo, Rep.Costa RicaCote d'IvoireCroatiaCubaCyprusCzech RepublicDenmarkDominicaDominican RepublicEarly-demographic dividendEast Asia & PacificEast Asia & Pacific (excluding high income)East Asia & Pacific (IDA & IBRD countries)EcuadorEgypt, Arab Rep.El SalvadorEstoniaEthiopiaEuro areaEurope & Central AsiaEurope & Central Asia (excluding high income)Europe & Central Asia (IDA & IBRD countries)European UnionFijiFinlandFragile and conflict affected situationsFranceGabonGambia, TheGeorgiaGermanyGhanaGreeceGreenlandGuatemalaGuineaGuyanaHaitiHeavily indebted poor countries (HIPC)High incomeHondurasHong Kong SAR, ChinaHungaryIBRD onlyIcelandIDA & IBRD totalIDA blendIDA onlyIDA totalIndiaIndonesiaIran, Islamic Rep.IraqIrelandIsraelItalyJamaicaJapanJordanKazakhstanKenyaKorea, Dem. People’s Rep.Korea, Rep.KuwaitLao PDRLate-demographic dividendLatin America & Caribbean Latin America & Caribbean (excluding high income)Latin America & the Caribbean (IDA & IBRD countries)LatviaLeast developed countries: UN classificationLebanonLiberiaLibyaLithuaniaLow & middle incomeLow incomeLower middle incomeLuxembourgMacao SAR, ChinaMacedonia, FYRMadagascarMalawiMalaysiaMaliMaltaMauritaniaMauritiusMexicoMiddle East & North AfricaMiddle East & North Africa (excluding high income)Middle East & North Africa (IDA & IBRD countries)Middle incomeMoldovaMongoliaMontenegroMoroccoMozambiqueMyanmarNetherlandsNew CaledoniaNew ZealandNicaraguaNigerNigeriaNorth AmericaNorwayOECD membersOmanOther small statesPacific island small statesPakistanPanamaPapua New GuineaParaguayPeruPhilippinesPolandPortugalPost-demographic dividendPre-demographic dividendQatarRomaniaRussian FederationRwandaSamoaSaudi ArabiaSenegalSerbiaSeychellesSierra LeoneSingaporeSlovak RepublicSloveniaSmall statesSomaliaSouth AfricaSouth AsiaSouth Asia (IDA & IBRD)SpainSri LankaSt. LuciaSt. Vincent and the GrenadinesSub-Saharan Africa Sub-Saharan Africa (excluding high income)Sub-Saharan Africa (IDA & IBRD countries)SudanSurinameSwedenSwitzerlandSyrian Arab RepublicTanzaniaThailandTogoTrinidad and TobagoTunisiaTurkeyUgandaUkraineUnited Arab EmiratesUnited KingdomUnited StatesUpper middle incomeUruguayVenezuela, RBVietnamWorldYemen, Rep.ZambiaZimbabwe Timeline:
This timeline shows a graph from 1961 to 2015 of South Asia. No data until 1960. Number of actual observations by date: 55.
Source name:
World Development Indicators
Source organization:
World Bank staff estimates based data from International Monetary Fund's Direction of Trade database.
Categories, topics:
Private Sector, Trade
Last updated:
apr 23, 2017
Indicators value changes by year
Maximum:
28.502
jan 1, 2015
At the date of observation
Value
Absolute change
Change from previous value
jan 1, 1961
14.522
+14.522
0.0%
jan 1, 1962
14.734
+0.212
1.46%
jan 1, 1963
13.578
-1.156
-7.85%
jan 1, 1964
12.187
-1.391
-10.24%
jan 1, 1965
13.479
+1.292
10.6%
jan 1, 1966
15.252
+1.773
13.15%
jan 1, 1967
15.057
-0.195
-1.28%
jan 1, 1968
13.912
-1.145
-7.61%
jan 1, 1969
12.383
-1.528
-10.99%
jan 1, 1970
15.092
+2.709
21.87%
jan 1, 1971
16.95
+1.858
12.31%
jan 1, 1972
15.47
-1.48
-8.73%
jan 1, 1973
13.145
-2.325
-15.03%
jan 1, 1974
12.472
-0.673
-5.12%
jan 1, 1975
18.556
+6.084
48.78%
jan 1, 1976
22.957
+4.401
23.72%
jan 1, 1977
18.242
-4.714
-20.54%
jan 1, 1978
17.628
-0.615
-3.37%
jan 1, 1979
17.707
+0.079
0.45%
jan 1, 1980
16.116
-1.591
-8.99%
jan 1, 1981
17.745
+1.629
10.11%
jan 1, 1982
19.957
+2.213
12.47%
jan 1, 1983
14.967
-4.99
-25.0%
jan 1, 1984
16.649
+1.682
11.24%
jan 1, 1985
14.29
-2.36
-14.17%
jan 1, 1986
12.202
-2.088
-14.61%
jan 1, 1987
9.731
-2.47
-20.24%
jan 1, 1988
9.011
-0.72
-7.4%
jan 1, 1989
8.844
-0.167
-1.85%
jan 1, 1990
8.022
-0.822
-9.3%
jan 1, 1991
8.997
+0.975
12.16%
jan 1, 1992
10.565
+1.568
17.43%
jan 1, 1993
11.52
+0.955
9.04%
jan 1, 1994
11.883
+0.363
3.15%
jan 1, 1995
10.661
-1.222
-10.29%
jan 1, 1996
13.014
+2.353
22.07%
jan 1, 1997
13.913
+0.899
6.91%
jan 1, 1998
14.02
+0.107
0.77%
jan 1, 1999
12.943
-1.078
-7.69%
jan 1, 2000
12.297
-0.646
-4.99%
jan 1, 2001
13.701
+1.404
11.42%
jan 1, 2002
15.638
+1.937
14.14%
jan 1, 2003
17.849
+2.211
14.14%
jan 1, 2004
18.473
+0.624
3.5%
jan 1, 2005
20.143
+1.67
9.04%
jan 1, 2006
21.014
+0.872
4.33%
jan 1, 2007
22.947
+1.932
9.19%
jan 1, 2008
24.995
+2.049
8.93%
jan 1, 2009
23.876
-1.12
-4.48%
jan 1, 2010
24.039
+0.163
0.68%
jan 1, 2011
26.911
+2.872
11.95%
jan 1, 2012
25.072
-1.839
-6.83%
jan 1, 2013
26.727
+1.655
6.6%
jan 1, 2014
27.269
+0.542
2.03%
jan 1, 2015
28.502
+1.233
4.52%
Ranking of countries by current statistics by years


Comments: