29
/
en
AIzaSyAYiBZKx7MnpbEhh9jyipgxe19OcubqV5w
April 1, 2024
157567
Iran, Islamic Rep.
IRN
true
2
1
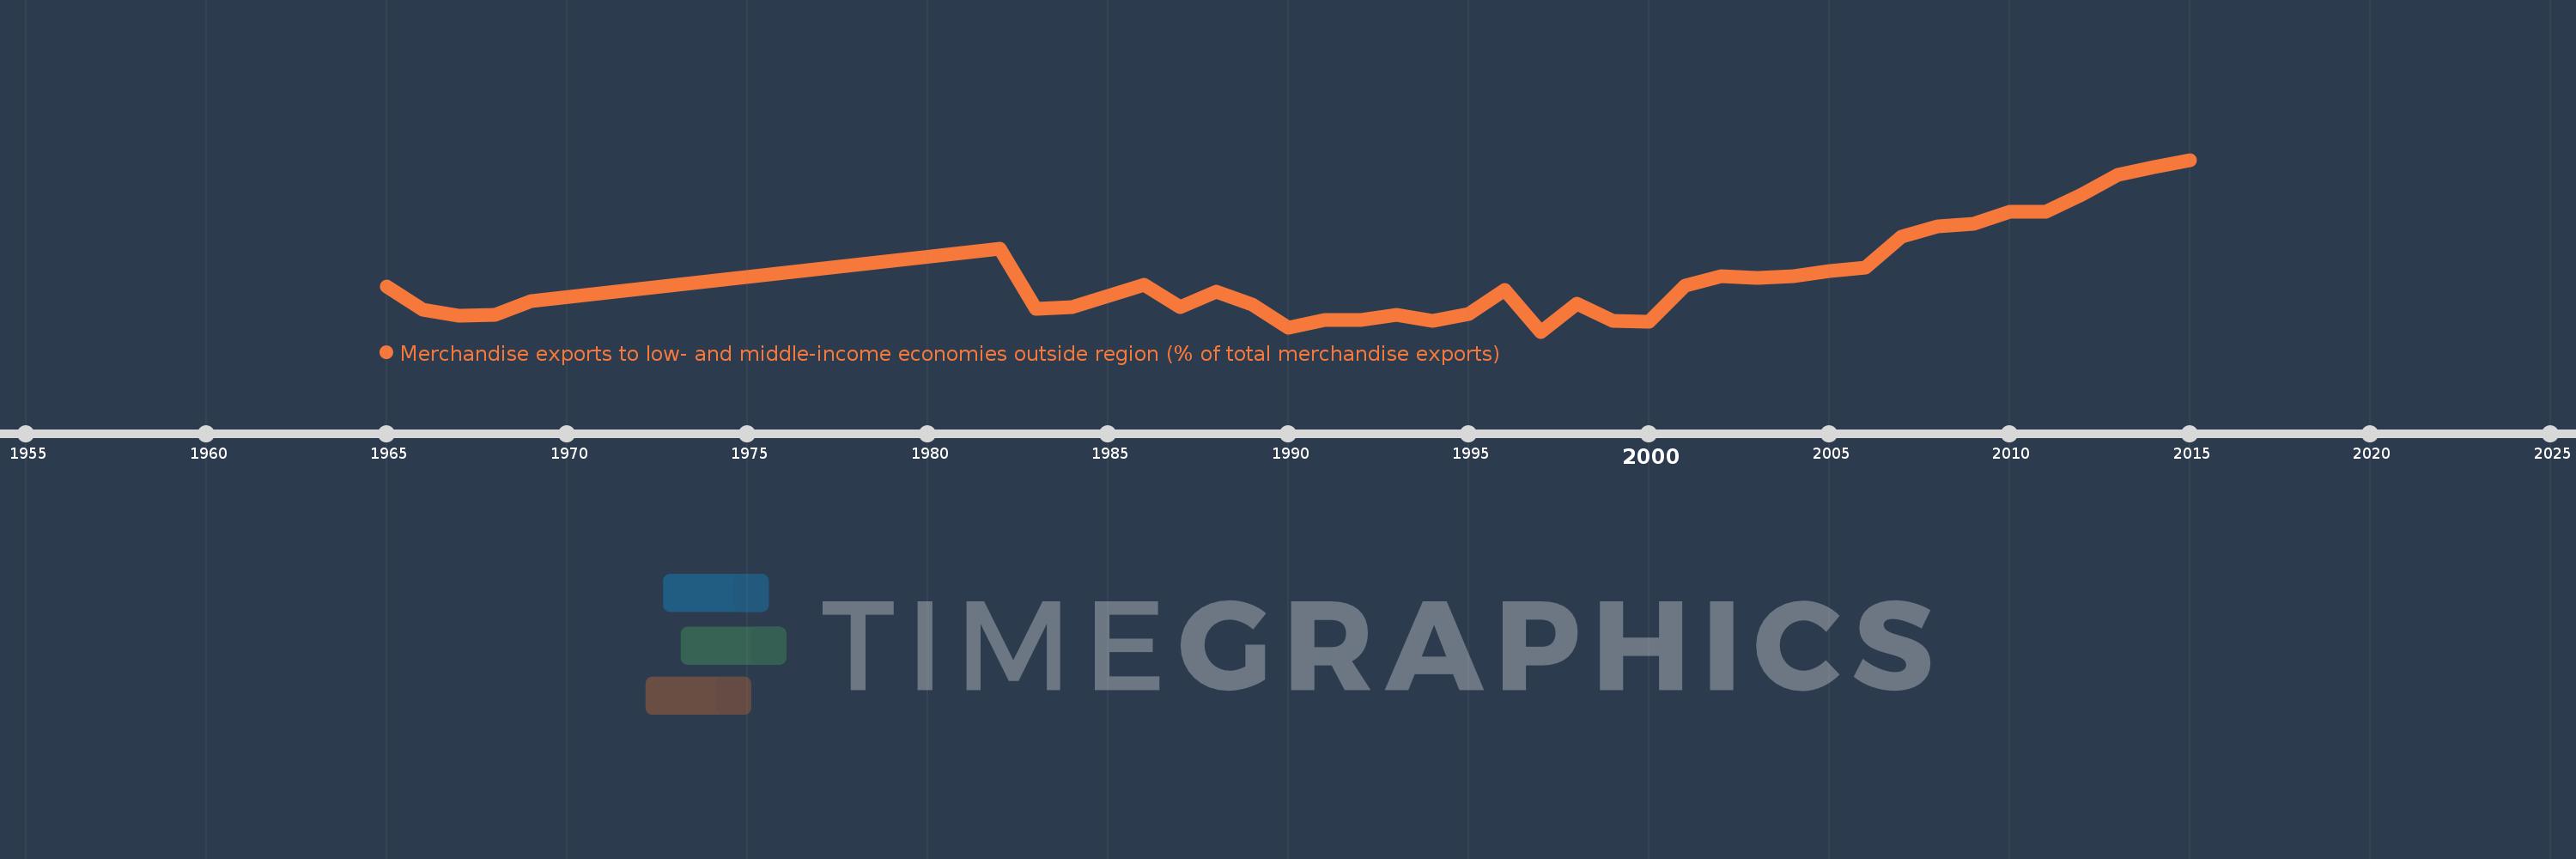
Merchandise exports to low- and middle-income economies outside region (% of total merchandise exports)
2015,2014,2013,2012,2011,2010,2009,2008,2007,2006,2005,2004,2003,2002,2001,2000,1999,1998,1997,1996,1995,1994,1993,1992,1991,1990,1989,1988,1987,1986,1985,1984,1983,1982,1969,1968,1967,1966,1965
This statistics in other country:
AfghanistanAlbaniaAlgeriaAngolaArab WorldArgentinaArmeniaArubaAustraliaAustriaAzerbaijanBahamas, TheBahrainBangladeshBarbadosBelarusBelgiumBelizeBeninBermudaBoliviaBrazilBrunei DarussalamBulgariaBurundiCabo VerdeCambodiaCameroonCanadaCaribbean small statesCentral African RepublicCentral Europe and the BalticsChileChinaColombiaCongo, Dem. Rep.Congo, Rep.Costa RicaCote d'IvoireCroatiaCubaCyprusCzech RepublicDenmarkDominicaDominican RepublicEarly-demographic dividendEast Asia & PacificEast Asia & Pacific (excluding high income)East Asia & Pacific (IDA & IBRD countries)EcuadorEgypt, Arab Rep.El SalvadorEstoniaEthiopiaEuro areaEurope & Central AsiaEurope & Central Asia (excluding high income)Europe & Central Asia (IDA & IBRD countries)European UnionFijiFinlandFragile and conflict affected situationsFranceGabonGambia, TheGeorgiaGermanyGhanaGreeceGreenlandGuatemalaGuineaGuyanaHaitiHeavily indebted poor countries (HIPC)High incomeHondurasHong Kong SAR, ChinaHungaryIBRD onlyIcelandIDA & IBRD totalIDA blendIDA onlyIDA totalIndiaIndonesiaIran, Islamic Rep.IraqIrelandIsraelItalyJamaicaJapanJordanKazakhstanKenyaKorea, Dem. People’s Rep.Korea, Rep.KuwaitLao PDRLate-demographic dividendLatin America & Caribbean Latin America & Caribbean (excluding high income)Latin America & the Caribbean (IDA & IBRD countries)LatviaLeast developed countries: UN classificationLebanonLiberiaLibyaLithuaniaLow & middle incomeLow incomeLower middle incomeLuxembourgMacao SAR, ChinaMacedonia, FYRMadagascarMalawiMalaysiaMaliMaltaMauritaniaMauritiusMexicoMiddle East & North AfricaMiddle East & North Africa (excluding high income)Middle East & North Africa (IDA & IBRD countries)Middle incomeMoldovaMongoliaMontenegroMoroccoMozambiqueMyanmarNetherlandsNew CaledoniaNew ZealandNicaraguaNigerNigeriaNorth AmericaNorwayOECD membersOmanOther small statesPacific island small statesPakistanPanamaPapua New GuineaParaguayPeruPhilippinesPolandPortugalPost-demographic dividendPre-demographic dividendQatarRomaniaRussian FederationRwandaSamoaSaudi ArabiaSenegalSerbiaSeychellesSierra LeoneSingaporeSlovak RepublicSloveniaSmall statesSomaliaSouth AfricaSouth AsiaSouth Asia (IDA & IBRD)SpainSri LankaSt. LuciaSt. Vincent and the GrenadinesSub-Saharan Africa Sub-Saharan Africa (excluding high income)Sub-Saharan Africa (IDA & IBRD countries)SudanSurinameSwedenSwitzerlandSyrian Arab RepublicTanzaniaThailandTogoTrinidad and TobagoTunisiaTurkeyUgandaUkraineUnited Arab EmiratesUnited KingdomUnited StatesUpper middle incomeUruguayVenezuela, RBVietnamWorldYemen, Rep.ZambiaZimbabwe Timeline:
This timeline shows a graph from 1965 to 2015 of Iran, Islamic Rep.. No data until 1964. Number of actual observations by date: 39.
Source name:
World Development Indicators
Source organization:
World Bank staff estimates based data from International Monetary Fund's Direction of Trade database.
Categories, topics:
Private Sector, Trade
Last updated:
apr 23, 2017
Indicators value changes by year
Minimum:
10.686
jan 1, 1997
At the date of observation
Value
Absolute change
Change from previous value
jan 1, 1965
22.182
+22.182
0.0%
jan 1, 1966
16.402
-5.78
-26.06%
jan 1, 1967
14.83
-1.572
-9.58%
jan 1, 1968
14.883
+0.053
0.36%
jan 1, 1969
18.533
+3.651
24.53%
jan 1, 1982
31.953
+13.42
72.41%
jan 1, 1983
16.593
-15.36
-48.07%
jan 1, 1984
16.964
+0.371
2.24%
jan 1, 1985
19.835
+2.871
16.92%
jan 1, 1986
22.773
+2.938
14.81%
jan 1, 1987
16.987
-5.786
-25.41%
jan 1, 1988
20.887
+3.9
22.96%
jan 1, 1989
17.579
-3.308
-15.84%
jan 1, 1990
11.772
-5.807
-33.03%
jan 1, 1991
13.707
+1.935
16.44%
jan 1, 1992
13.722
+0.015
0.11%
jan 1, 1993
14.908
+1.186
8.64%
jan 1, 1994
13.374
-1.534
-10.29%
jan 1, 1995
15.248
+1.874
14.01%
jan 1, 1996
21.471
+6.223
40.81%
jan 1, 1997
10.686
-10.785
-50.23%
jan 1, 1998
17.826
+7.139
66.81%
jan 1, 1999
13.526
-4.299
-24.12%
jan 1, 2000
13.244
-0.282
-2.09%
jan 1, 2001
22.584
+9.34
70.52%
jan 1, 2002
24.896
+2.312
10.24%
jan 1, 2003
24.415
-0.481
-1.93%
jan 1, 2004
24.886
+0.471
1.93%
jan 1, 2005
26.153
+1.267
5.09%
jan 1, 2006
27.071
+0.918
3.51%
jan 1, 2007
34.988
+7.917
29.24%
jan 1, 2008
37.671
+2.683
7.67%
jan 1, 2009
38.458
+0.787
2.09%
jan 1, 2010
41.505
+3.046
7.92%
jan 1, 2011
41.572
+0.068
0.16%
jan 1, 2012
45.973
+4.4
10.59%
jan 1, 2013
50.942
+4.97
10.81%
jan 1, 2014
52.844
+1.901
3.73%
jan 1, 2015
54.81
+1.966
3.72%
Ranking of countries by current statistics by years


Comments: