29
/
en
AIzaSyAYiBZKx7MnpbEhh9jyipgxe19OcubqV5w
April 1, 2024
214564
Norway
NOR
true
2
1
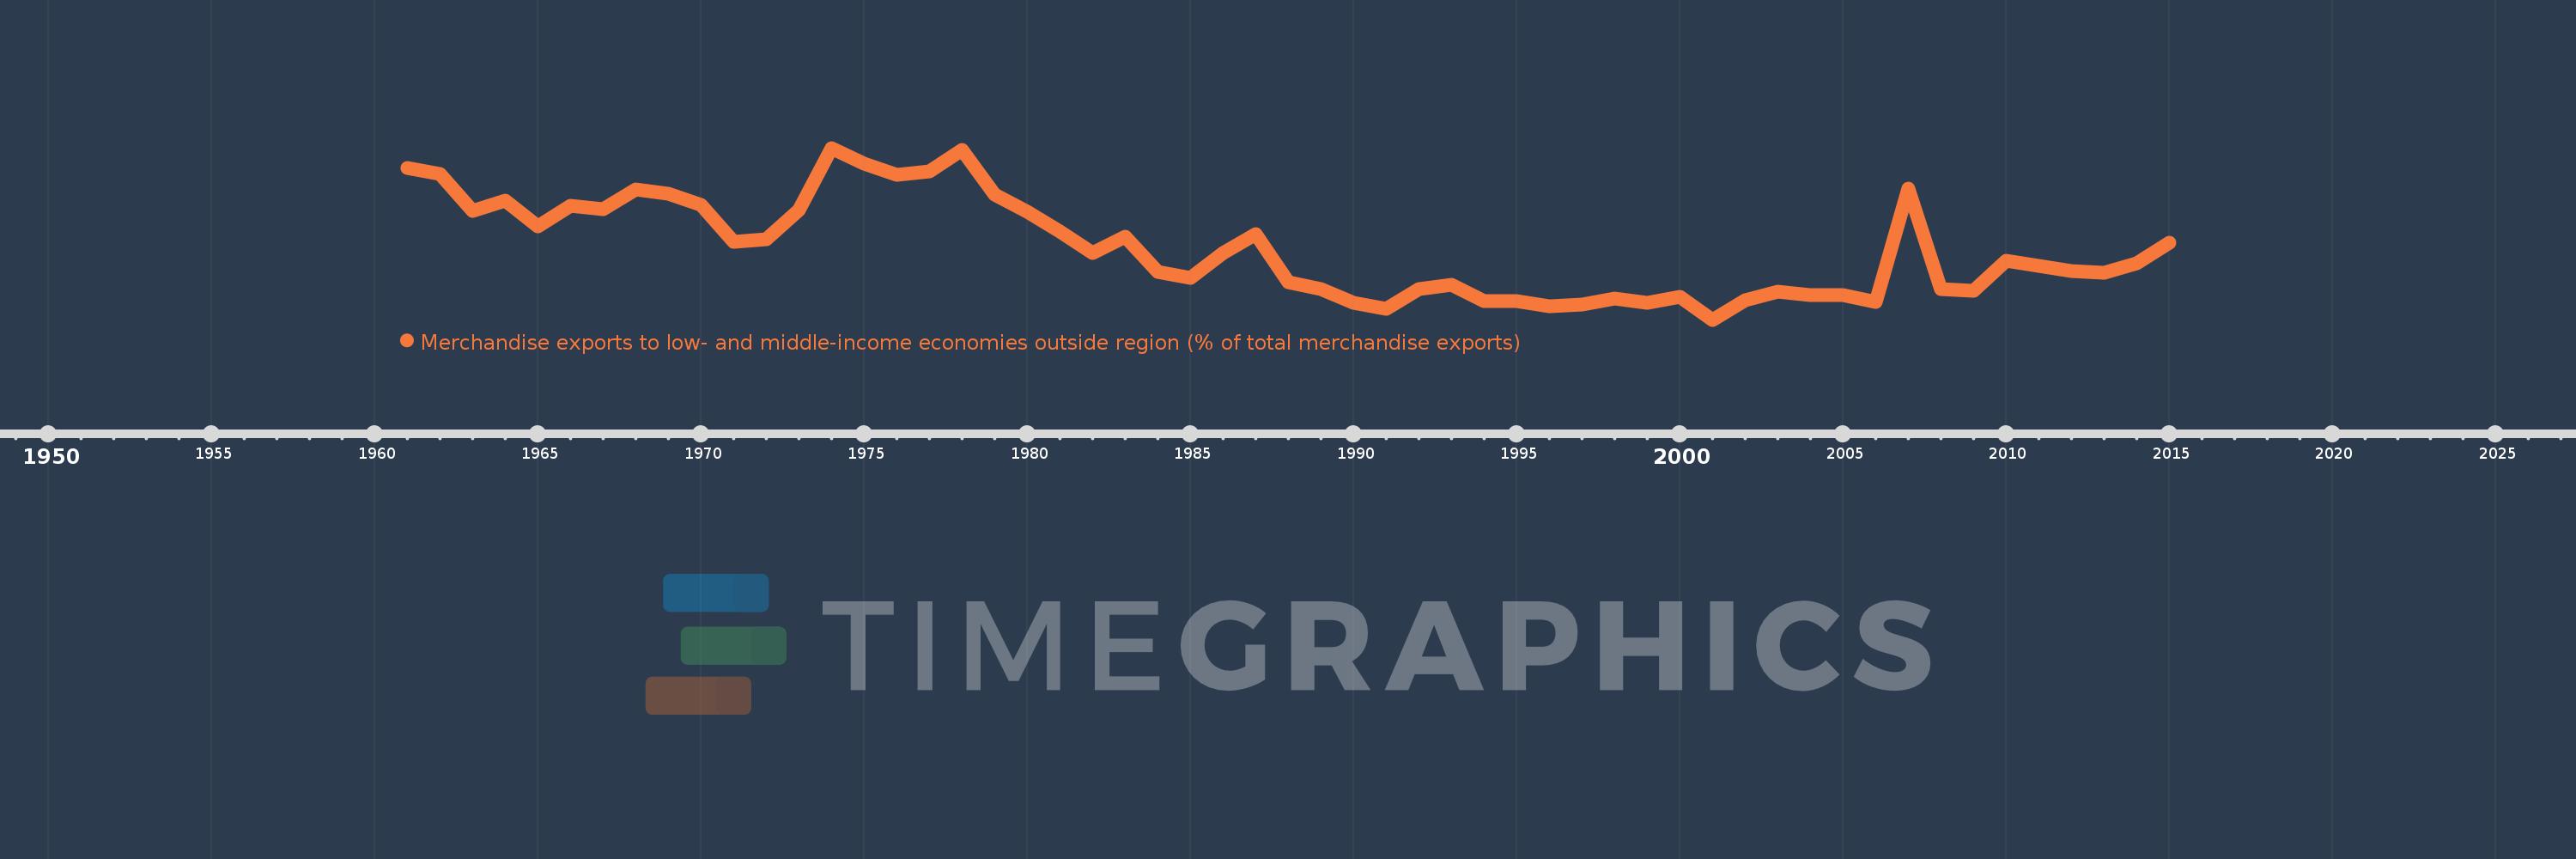
Merchandise exports to low- and middle-income economies outside region (% of total merchandise exports)
2015,2014,2013,2012,2011,2010,2009,2008,2007,2006,2005,2004,2003,2002,2001,2000,1999,1998,1997,1996,1995,1994,1993,1992,1991,1990,1989,1988,1987,1986,1985,1984,1983,1982,1981,1980,1979,1978,1977,1976,1975,1974,1973,1972,1971,1970,1969,1968,1967,1966,1965,1964,1963,1962,1961
This statistics in other country:
AfghanistanAlbaniaAlgeriaAngolaArab WorldArgentinaArmeniaArubaAustraliaAustriaAzerbaijanBahamas, TheBahrainBangladeshBarbadosBelarusBelgiumBelizeBeninBermudaBoliviaBrazilBrunei DarussalamBulgariaBurundiCabo VerdeCambodiaCameroonCanadaCaribbean small statesCentral African RepublicCentral Europe and the BalticsChileChinaColombiaCongo, Dem. Rep.Congo, Rep.Costa RicaCote d'IvoireCroatiaCubaCyprusCzech RepublicDenmarkDominicaDominican RepublicEarly-demographic dividendEast Asia & PacificEast Asia & Pacific (excluding high income)East Asia & Pacific (IDA & IBRD countries)EcuadorEgypt, Arab Rep.El SalvadorEstoniaEthiopiaEuro areaEurope & Central AsiaEurope & Central Asia (excluding high income)Europe & Central Asia (IDA & IBRD countries)European UnionFijiFinlandFragile and conflict affected situationsFranceGabonGambia, TheGeorgiaGermanyGhanaGreeceGreenlandGuatemalaGuineaGuyanaHaitiHeavily indebted poor countries (HIPC)High incomeHondurasHong Kong SAR, ChinaHungaryIBRD onlyIcelandIDA & IBRD totalIDA blendIDA onlyIDA totalIndiaIndonesiaIran, Islamic Rep.IraqIrelandIsraelItalyJamaicaJapanJordanKazakhstanKenyaKorea, Dem. People’s Rep.Korea, Rep.KuwaitLao PDRLate-demographic dividendLatin America & Caribbean Latin America & Caribbean (excluding high income)Latin America & the Caribbean (IDA & IBRD countries)LatviaLeast developed countries: UN classificationLebanonLiberiaLibyaLithuaniaLow & middle incomeLow incomeLower middle incomeLuxembourgMacao SAR, ChinaMacedonia, FYRMadagascarMalawiMalaysiaMaliMaltaMauritaniaMauritiusMexicoMiddle East & North AfricaMiddle East & North Africa (excluding high income)Middle East & North Africa (IDA & IBRD countries)Middle incomeMoldovaMongoliaMontenegroMoroccoMozambiqueMyanmarNetherlandsNew CaledoniaNew ZealandNicaraguaNigerNigeriaNorth AmericaNorwayOECD membersOmanOther small statesPacific island small statesPakistanPanamaPapua New GuineaParaguayPeruPhilippinesPolandPortugalPost-demographic dividendPre-demographic dividendQatarRomaniaRussian FederationRwandaSamoaSaudi ArabiaSenegalSerbiaSeychellesSierra LeoneSingaporeSlovak RepublicSloveniaSmall statesSomaliaSouth AfricaSouth AsiaSouth Asia (IDA & IBRD)SpainSri LankaSt. LuciaSt. Vincent and the GrenadinesSub-Saharan Africa Sub-Saharan Africa (excluding high income)Sub-Saharan Africa (IDA & IBRD countries)SudanSurinameSwedenSwitzerlandSyrian Arab RepublicTanzaniaThailandTogoTrinidad and TobagoTunisiaTurkeyUgandaUkraineUnited Arab EmiratesUnited KingdomUnited StatesUpper middle incomeUruguayVenezuela, RBVietnamWorldYemen, Rep.ZambiaZimbabwe Timeline:
This timeline shows a graph from 1961 to 2015 of Norway. No data until 1960. Number of actual observations by date: 55.
Source name:
World Development Indicators
Source organization:
World Bank staff estimates based data from International Monetary Fund's Direction of Trade database.
Categories, topics:
Private Sector, Trade
Last updated:
apr 23, 2017
Indicators value changes by year
Maximum:
12.681
jan 1, 1974
At the date of observation
Value
Absolute change
Change from previous value
jan 1, 1961
11.496
+11.496
0.0%
jan 1, 1962
11.13
-0.365
-3.18%
jan 1, 1963
8.944
-2.186
-19.64%
jan 1, 1964
9.552
+0.608
6.8%
jan 1, 1965
8.031
-1.52
-15.92%
jan 1, 1966
9.254
+1.223
15.23%
jan 1, 1967
9.033
-0.222
-2.4%
jan 1, 1968
10.226
+1.193
13.21%
jan 1, 1969
9.956
-0.27
-2.64%
jan 1, 1970
9.275
-0.681
-6.84%
jan 1, 1971
7.095
-2.18
-23.5%
jan 1, 1972
7.245
+0.15
2.11%
jan 1, 1973
8.978
+1.734
23.93%
jan 1, 1974
12.681
+3.703
41.24%
jan 1, 1975
11.726
-0.955
-7.53%
jan 1, 1976
11.085
-0.641
-5.47%
jan 1, 1977
11.304
+0.218
1.97%
jan 1, 1978
12.547
+1.243
11.0%
jan 1, 1979
9.92
-2.626
-20.93%
jan 1, 1980
8.874
-1.047
-10.55%
jan 1, 1981
7.694
-1.18
-13.3%
jan 1, 1982
6.442
-1.252
-16.28%
jan 1, 1983
7.396
+0.954
14.81%
jan 1, 1984
5.32
-2.076
-28.07%
jan 1, 1985
4.957
-0.363
-6.82%
jan 1, 1986
6.443
+1.485
29.96%
jan 1, 1987
7.562
+1.12
17.38%
jan 1, 1988
4.678
-2.884
-38.14%
jan 1, 1989
4.256
-0.423
-9.03%
jan 1, 1990
3.474
-0.782
-18.38%
jan 1, 1991
3.113
-0.361
-10.38%
jan 1, 1992
4.268
+1.155
37.11%
jan 1, 1993
4.545
+0.277
6.49%
jan 1, 1994
3.581
-0.965
-21.22%
jan 1, 1995
3.547
-0.034
-0.95%
jan 1, 1996
3.223
-0.324
-9.12%
jan 1, 1997
3.365
+0.142
4.39%
jan 1, 1998
3.732
+0.367
10.91%
jan 1, 1999
3.433
-0.299
-8.01%
jan 1, 2000
3.793
+0.36
10.5%
jan 1, 2001
2.445
-1.348
-35.54%
jan 1, 2002
3.599
+1.154
47.19%
jan 1, 2003
4.098
+0.499
13.86%
jan 1, 2004
3.922
-0.176
-4.3%
jan 1, 2005
3.9
-0.022
-0.56%
jan 1, 2006
3.489
-0.411
-10.54%
jan 1, 2007
10.244
+6.755
193.62%
jan 1, 2008
4.287
-5.958
-58.15%
jan 1, 2009
4.153
-0.134
-3.12%
jan 1, 2010
5.941
+1.788
43.06%
jan 1, 2011
5.631
-0.31
-5.22%
jan 1, 2012
5.361
-0.27
-4.79%
jan 1, 2013
5.238
-0.123
-2.29%
jan 1, 2014
5.811
+0.573
10.94%
jan 1, 2015
7.057
+1.246
21.43%
Ranking of countries by current statistics by years


Comments: