29
/
en
AIzaSyAYiBZKx7MnpbEhh9jyipgxe19OcubqV5w
April 1, 2024
154896
India
IND
true
2
1
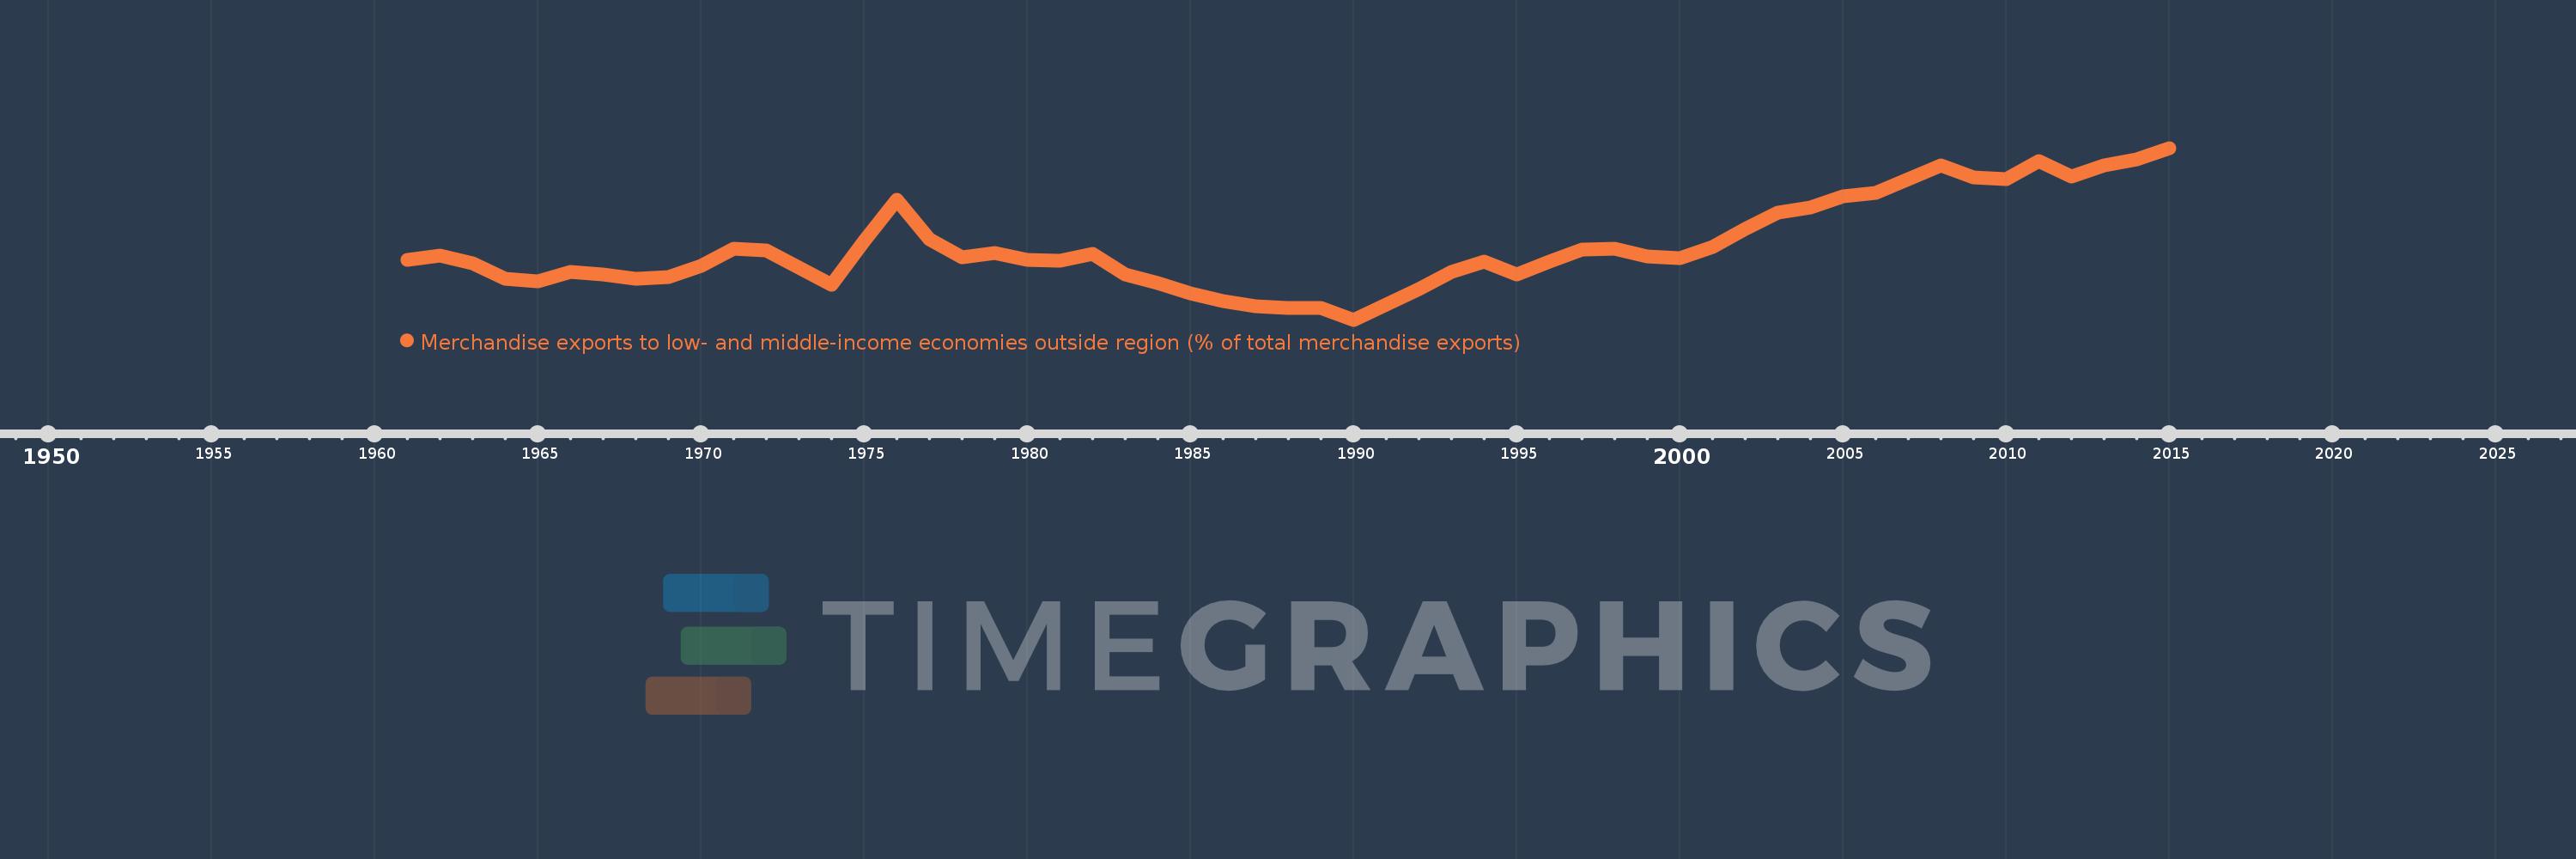
Merchandise exports to low- and middle-income economies outside region (% of total merchandise exports)
2015,2014,2013,2012,2011,2010,2009,2008,2007,2006,2005,2004,2003,2002,2001,2000,1999,1998,1997,1996,1995,1994,1993,1992,1991,1990,1989,1988,1987,1986,1985,1984,1983,1982,1981,1980,1979,1978,1977,1976,1975,1974,1973,1972,1971,1970,1969,1968,1967,1966,1965,1964,1963,1962,1961
This statistics in other country:
AfghanistanAlbaniaAlgeriaAngolaArab WorldArgentinaArmeniaArubaAustraliaAustriaAzerbaijanBahamas, TheBahrainBangladeshBarbadosBelarusBelgiumBelizeBeninBermudaBoliviaBrazilBrunei DarussalamBulgariaBurundiCabo VerdeCambodiaCameroonCanadaCaribbean small statesCentral African RepublicCentral Europe and the BalticsChileChinaColombiaCongo, Dem. Rep.Congo, Rep.Costa RicaCote d'IvoireCroatiaCubaCyprusCzech RepublicDenmarkDominicaDominican RepublicEarly-demographic dividendEast Asia & PacificEast Asia & Pacific (excluding high income)East Asia & Pacific (IDA & IBRD countries)EcuadorEgypt, Arab Rep.El SalvadorEstoniaEthiopiaEuro areaEurope & Central AsiaEurope & Central Asia (excluding high income)Europe & Central Asia (IDA & IBRD countries)European UnionFijiFinlandFragile and conflict affected situationsFranceGabonGambia, TheGeorgiaGermanyGhanaGreeceGreenlandGuatemalaGuineaGuyanaHaitiHeavily indebted poor countries (HIPC)High incomeHondurasHong Kong SAR, ChinaHungaryIBRD onlyIcelandIDA & IBRD totalIDA blendIDA onlyIDA totalIndiaIndonesiaIran, Islamic Rep.IraqIrelandIsraelItalyJamaicaJapanJordanKazakhstanKenyaKorea, Dem. People’s Rep.Korea, Rep.KuwaitLao PDRLate-demographic dividendLatin America & Caribbean Latin America & Caribbean (excluding high income)Latin America & the Caribbean (IDA & IBRD countries)LatviaLeast developed countries: UN classificationLebanonLiberiaLibyaLithuaniaLow & middle incomeLow incomeLower middle incomeLuxembourgMacao SAR, ChinaMacedonia, FYRMadagascarMalawiMalaysiaMaliMaltaMauritaniaMauritiusMexicoMiddle East & North AfricaMiddle East & North Africa (excluding high income)Middle East & North Africa (IDA & IBRD countries)Middle incomeMoldovaMongoliaMontenegroMoroccoMozambiqueMyanmarNetherlandsNew CaledoniaNew ZealandNicaraguaNigerNigeriaNorth AmericaNorwayOECD membersOmanOther small statesPacific island small statesPakistanPanamaPapua New GuineaParaguayPeruPhilippinesPolandPortugalPost-demographic dividendPre-demographic dividendQatarRomaniaRussian FederationRwandaSamoaSaudi ArabiaSenegalSerbiaSeychellesSierra LeoneSingaporeSlovak RepublicSloveniaSmall statesSomaliaSouth AfricaSouth AsiaSouth Asia (IDA & IBRD)SpainSri LankaSt. LuciaSt. Vincent and the GrenadinesSub-Saharan Africa Sub-Saharan Africa (excluding high income)Sub-Saharan Africa (IDA & IBRD countries)SudanSurinameSwedenSwitzerlandSyrian Arab RepublicTanzaniaThailandTogoTrinidad and TobagoTunisiaTurkeyUgandaUkraineUnited Arab EmiratesUnited KingdomUnited StatesUpper middle incomeUruguayVenezuela, RBVietnamWorldYemen, Rep.ZambiaZimbabwe Timeline:
This timeline shows a graph from 1961 to 2015 of India. No data until 1960. Number of actual observations by date: 55.
Source name:
World Development Indicators
Source organization:
World Bank staff estimates based data from International Monetary Fund's Direction of Trade database.
Categories, topics:
Private Sector, Trade
Last updated:
apr 23, 2017
Indicators value changes by year
Maximum:
31.166
jan 1, 2015
At the date of observation
Value
Absolute change
Change from previous value
jan 1, 1961
14.062
+14.062
0.0%
jan 1, 1962
14.685
+0.623
4.43%
jan 1, 1963
13.516
-1.169
-7.96%
jan 1, 1964
11.165
-2.35
-17.39%
jan 1, 1965
10.77
-0.395
-3.54%
jan 1, 1966
12.292
+1.522
14.13%
jan 1, 1967
11.848
-0.444
-3.61%
jan 1, 1968
11.2
-0.648
-5.47%
jan 1, 1969
11.519
+0.32
2.85%
jan 1, 1970
13.139
+1.619
14.06%
jan 1, 1971
15.789
+2.65
20.17%
jan 1, 1972
15.59
-0.199
-1.26%
jan 1, 1973
12.937
-2.653
-17.01%
jan 1, 1974
10.348
-2.59
-20.02%
jan 1, 1975
16.973
+6.626
64.03%
jan 1, 1976
23.268
+6.294
37.08%
jan 1, 1977
17.179
-6.088
-26.17%
jan 1, 1978
14.528
-2.652
-15.44%
jan 1, 1979
15.137
+0.609
4.2%
jan 1, 1980
14.122
-1.015
-6.71%
jan 1, 1981
13.963
-0.159
-1.12%
jan 1, 1982
15.072
+1.108
7.94%
jan 1, 1983
11.857
-3.214
-21.33%
jan 1, 1984
10.515
-1.342
-11.32%
jan 1, 1985
8.968
-1.547
-14.71%
jan 1, 1986
7.839
-1.129
-12.59%
jan 1, 1987
7.021
-0.817
-10.43%
jan 1, 1988
6.745
-0.276
-3.93%
jan 1, 1989
6.785
+0.039
0.58%
jan 1, 1990
4.958
-1.827
-26.93%
jan 1, 1991
7.308
+2.35
47.4%
jan 1, 1992
9.619
+2.311
31.62%
jan 1, 1993
12.241
+2.622
27.26%
jan 1, 1994
13.848
+1.608
13.13%
jan 1, 1995
11.894
-1.954
-14.11%
jan 1, 1996
13.814
+1.919
16.14%
jan 1, 1997
15.711
+1.898
13.74%
jan 1, 1998
15.753
+0.041
0.26%
jan 1, 1999
14.647
-1.105
-7.02%
jan 1, 2000
14.36
-0.287
-1.96%
jan 1, 2001
16.052
+1.692
11.78%
jan 1, 2002
18.803
+2.75
17.13%
jan 1, 2003
21.24
+2.438
12.96%
jan 1, 2004
22.053
+0.813
3.83%
jan 1, 2005
23.832
+1.779
8.07%
jan 1, 2006
24.374
+0.542
2.27%
jan 1, 2007
26.443
+2.069
8.49%
jan 1, 2008
28.472
+2.029
7.67%
jan 1, 2009
26.62
-1.852
-6.5%
jan 1, 2010
26.39
-0.23
-0.86%
jan 1, 2011
29.197
+2.808
10.64%
jan 1, 2012
26.856
-2.342
-8.02%
jan 1, 2013
28.536
+1.681
6.26%
jan 1, 2014
29.453
+0.917
3.21%
jan 1, 2015
31.166
+1.713
5.82%
Ranking of countries by current statistics by years


Comments: