29
/
en
AIzaSyAYiBZKx7MnpbEhh9jyipgxe19OcubqV5w
April 1, 2024
50055
Middle East & North Africa (IDA & IBRD countries)
TMN
false
2
1
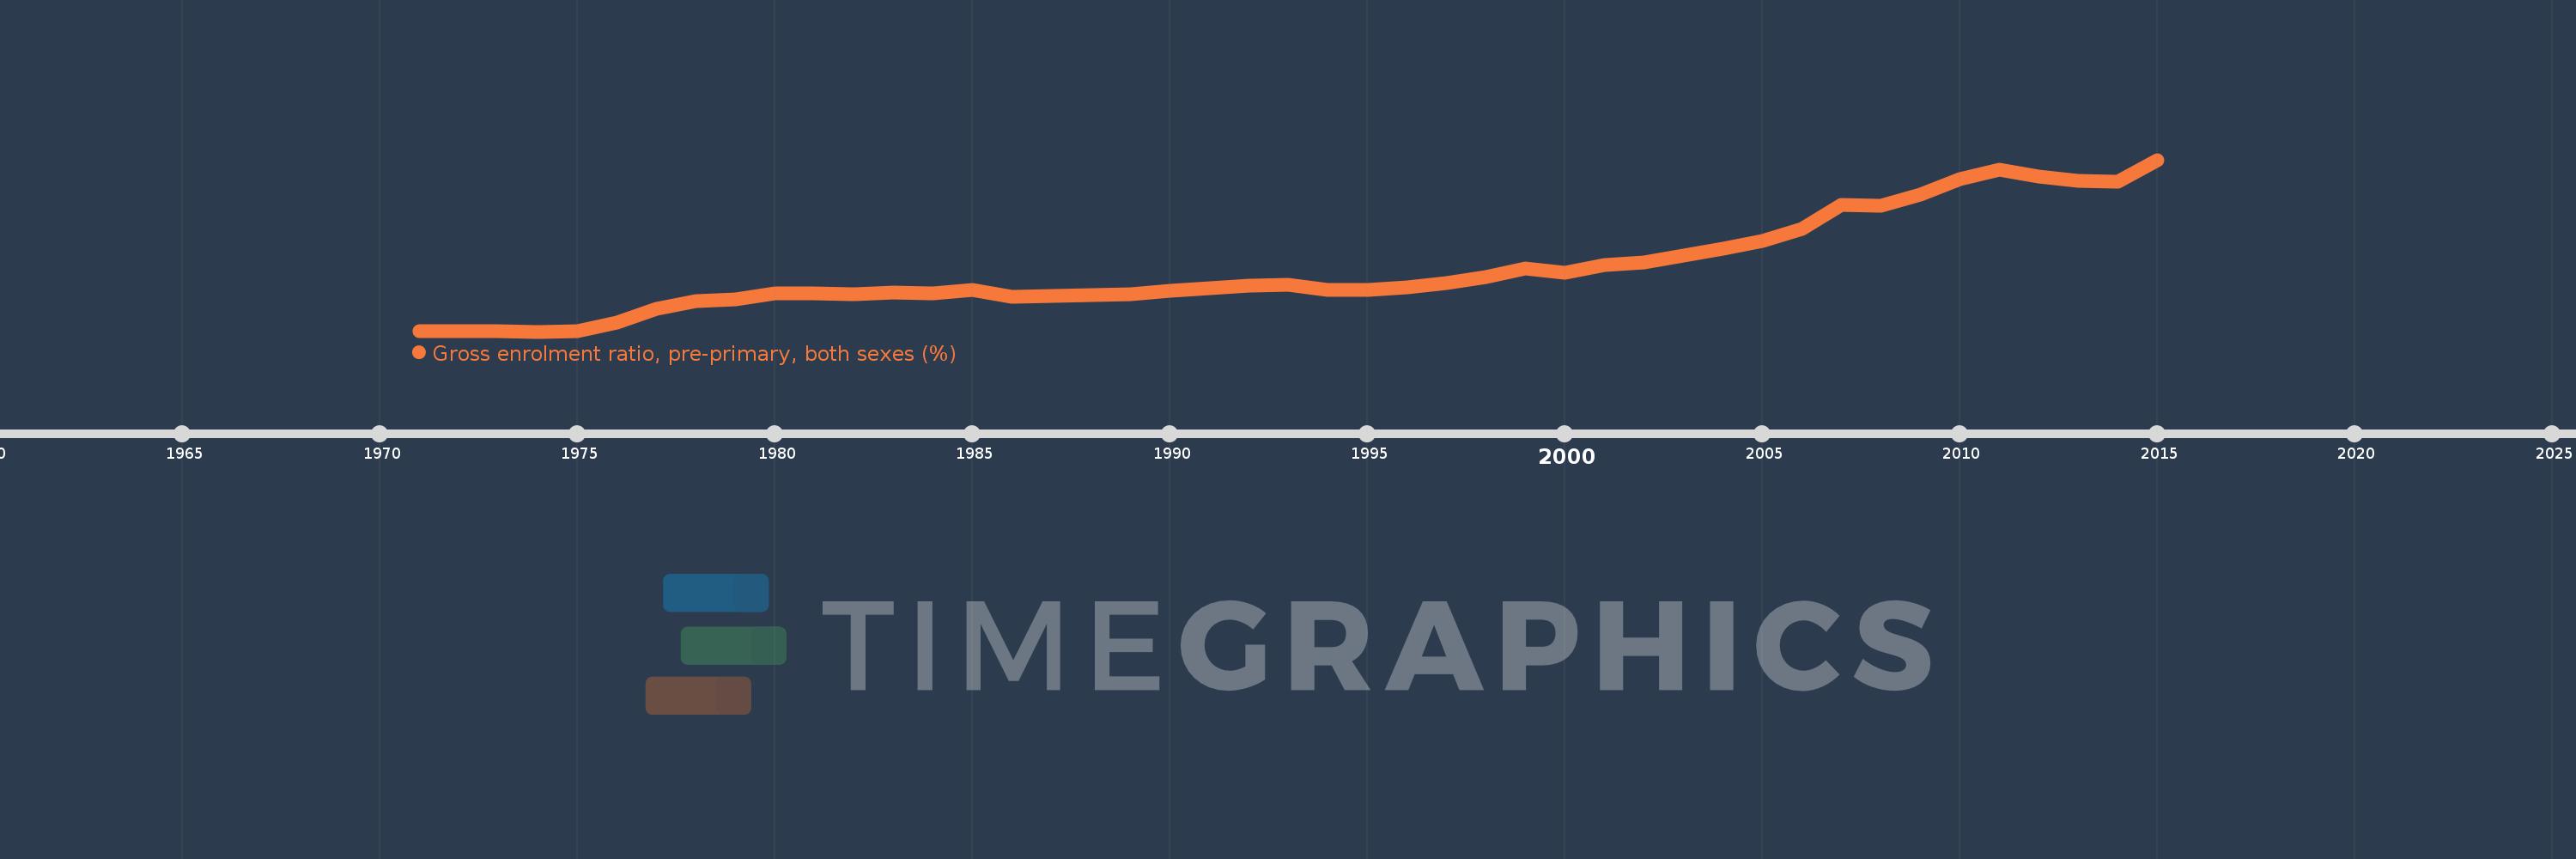
Gross enrolment ratio, pre-primary, both sexes (%)
2015,2014,2013,2012,2011,2010,2009,2008,2007,2006,2005,2004,2003,2002,2001,2000,1999,1998,1997,1996,1995,1994,1993,1992,1991,1990,1989,1988,1987,1986,1985,1984,1983,1982,1981,1980,1979,1978,1977,1976,1975,1974,1973,1972,1971
This statistics in other country:
AfghanistanAlbaniaAlgeriaAndorraAngolaAntigua and BarbudaArab WorldArgentinaArmeniaArubaAustraliaAustriaAzerbaijanBahamas, TheBahrainBangladeshBarbadosBelarusBelgiumBelizeBeninBermudaBhutanBoliviaBosnia and HerzegovinaBotswanaBrazilBritish Virgin IslandsBrunei DarussalamBulgariaBurkina FasoBurundiCabo VerdeCambodiaCameroonCanadaCaribbean small statesCentral African RepublicCentral Europe and the BalticsChadChileChinaColombiaComorosCongo, Dem. Rep.Congo, Rep.Costa RicaCote d'IvoireCroatiaCubaCyprusCzech RepublicDenmarkDjiboutiDominicaDominican RepublicEarly-demographic dividendEast Asia & PacificEast Asia & Pacific (excluding high income)East Asia & Pacific (IDA & IBRD countries)EcuadorEgypt, Arab Rep.El SalvadorEquatorial GuineaEritreaEstoniaEthiopiaEuro areaEurope & Central AsiaEurope & Central Asia (excluding high income)Europe & Central Asia (IDA & IBRD countries)European UnionFijiFinlandFragile and conflict affected situationsFranceGabonGambia, TheGeorgiaGermanyGhanaGreeceGrenadaGuatemalaGuineaGuinea-BissauGuyanaHaitiHeavily indebted poor countries (HIPC)High incomeHondurasHong Kong SAR, ChinaHungaryIBRD onlyIcelandIDA & IBRD totalIDA blendIDA onlyIDA totalIndiaIndonesiaIran, Islamic Rep.IraqIrelandIsraelItalyJamaicaJapanJordanKazakhstanKenyaKiribatiKorea, Dem. People’s Rep.Korea, Rep.KuwaitKyrgyz RepublicLao PDRLate-demographic dividendLatin America & Caribbean Latin America & Caribbean (excluding high income)Latin America & the Caribbean (IDA & IBRD countries)LatviaLeast developed countries: UN classificationLebanonLesothoLiberiaLibyaLiechtensteinLithuaniaLow & middle incomeLow incomeLower middle incomeLuxembourgMacao SAR, ChinaMacedonia, FYRMadagascarMalaysiaMaldivesMaliMaltaMarshall IslandsMauritaniaMauritiusMexicoMicronesia, Fed. Sts.Middle East & North AfricaMiddle East & North Africa (excluding high income)Middle East & North Africa (IDA & IBRD countries)Middle incomeMoldovaMongoliaMontenegroMoroccoMozambiqueMyanmarNamibiaNauruNepalNetherlandsNew ZealandNicaraguaNigerNigeriaNorth AmericaNorwayOECD membersOmanOther small statesPacific island small statesPakistanPalauPanamaPapua New GuineaParaguayPeruPhilippinesPolandPortugalPost-demographic dividendPre-demographic dividendPuerto RicoQatarRomaniaRussian FederationRwandaSamoaSan MarinoSao Tome and PrincipeSaudi ArabiaSenegalSerbiaSeychellesSierra LeoneSlovak RepublicSloveniaSmall statesSolomon IslandsSomaliaSouth AfricaSouth AsiaSouth Asia (IDA & IBRD)South SudanSpainSri LankaSt. Kitts and NevisSt. LuciaSt. Vincent and the GrenadinesSub-Saharan Africa Sub-Saharan Africa (excluding high income)Sub-Saharan Africa (IDA & IBRD countries)SudanSurinameSwazilandSwedenSwitzerlandSyrian Arab RepublicTajikistanTanzaniaThailandTimor-LesteTogoTongaTrinidad and TobagoTunisiaTurkeyTurkmenistanTuvaluUgandaUkraineUnited Arab EmiratesUnited KingdomUnited StatesUpper middle incomeUruguayUzbekistanVanuatuVenezuela, RBVietnamWest Bank and GazaWorldYemen, Rep.ZambiaZimbabwe Timeline:
This timeline shows a graph from 1971 to 2015 of Middle East & North Africa (IDA & IBRD countries). No data until 1970. Number of actual observations by date: 45.
Source name:
World Development Indicators
Source organization:
UNESCO Institute for Statistics
Categories, topics:
Education
Last updated:
apr 23, 2017
Indicators value changes by year
Maximum:
27.117
jan 1, 2015
At the date of observation
Value
Absolute change
Change from previous value
jan 1, 1971
7.375
+7.375
0.0%
jan 1, 1972
7.32
-0.056
-0.76%
jan 1, 1973
7.291
-0.029
-0.39%
jan 1, 1974
7.282
-0.009
-0.13%
jan 1, 1975
7.378
+0.097
1.33%
jan 1, 1976
8.362
+0.983
13.33%
jan 1, 1977
9.953
+1.591
19.03%
jan 1, 1978
10.82
+0.867
8.71%
jan 1, 1979
11.038
+0.219
2.02%
jan 1, 1980
11.663
+0.625
5.66%
jan 1, 1981
11.725
+0.062
0.53%
jan 1, 1982
11.597
-0.128
-1.09%
jan 1, 1983
11.78
+0.183
1.58%
jan 1, 1984
11.651
-0.129
-1.1%
jan 1, 1985
12.08
+0.429
3.68%
jan 1, 1986
11.272
-0.807
-6.68%
jan 1, 1987
11.385
+0.113
1.0%
jan 1, 1988
11.516
+0.131
1.15%
jan 1, 1989
11.593
+0.077
0.67%
jan 1, 1990
11.998
+0.405
3.49%
jan 1, 1991
12.325
+0.327
2.73%
jan 1, 1992
12.618
+0.293
2.37%
jan 1, 1993
12.664
+0.046
0.36%
jan 1, 1994
12.125
-0.538
-4.25%
jan 1, 1995
12.061
-0.065
-0.54%
jan 1, 1996
12.36
+0.3
2.48%
jan 1, 1997
12.929
+0.569
4.61%
jan 1, 1998
13.533
+0.604
4.67%
jan 1, 1999
14.578
+1.045
7.72%
jan 1, 2000
14.099
-0.479
-3.29%
jan 1, 2001
14.961
+0.862
6.11%
jan 1, 2002
15.292
+0.33
2.21%
jan 1, 2003
16.032
+0.741
4.84%
jan 1, 2004
16.806
+0.774
4.83%
jan 1, 2005
17.75
+0.945
5.62%
jan 1, 2006
19.174
+1.424
8.02%
jan 1, 2007
21.898
+2.723
14.2%
jan 1, 2008
21.822
-0.076
-0.35%
jan 1, 2009
23.086
+1.264
5.79%
jan 1, 2010
24.91
+1.825
7.9%
jan 1, 2011
25.944
+1.034
4.15%
jan 1, 2012
25.179
-0.765
-2.95%
jan 1, 2013
24.642
-0.537
-2.13%
jan 1, 2014
24.547
-0.095
-0.39%
jan 1, 2015
27.117
+2.571
10.47%
Ranking of countries by current statistics by years


Comments: